November 2023 (version 1.85)
Update 1.85.1: The update addresses these issues.
Update 1.85.2: The update addresses these issues.
Downloads: Windows: x64 Arm64 | Mac: Universal Intel silicon | Linux: deb rpm tarball Arm snap
Welcome to the November 2023 release of Visual Studio Code. There are many updates in this version that we hope you'll like, some of the key highlights include:
- Floating editor windows - Drag and drop editors onto your desktop.
- Accessible View workflow - Smoother transitions to and from the Accessible View.
- Finer extension update control - Choose which extensions to auto update.
- Source Control incoming and outgoing view - Easily review pending repository changes.
- JavaScript heap snapshots - Visualize heap snapshots including memory object graphs.
- TypeScript Go to Definition from inlay hints - Jump to definition from inlay hint hovers.
- Python type hierarchy display - Quickly review and navigate complex type relationships.
- GitHub Copilot updates - Inline chat improvements, Rust code explanation.
- Preview: expanded Sticky Scroll support - Sticky Scroll in tree views and the terminal.
If you'd like to read these release notes online, go to Updates on code.visualstudio.com.
Insiders: Want to try new features as soon as possible? You can download the nightly Insiders build and try the latest updates as soon as they are available.
GitHub Universe, Copilot, and VS Code
If you were able to watch or attend GitHub Universe this year, you saw that GitHub Copilot was center stage. Copilot was featured in the Opening Keynote and breakout sessions such as GitHub Copilot: the AI pair programmer for today and tomorrow.
The VS Code team has been working hard to integrate Copilot into the editor and you can learn more about the team's progress leading up to GitHub Universe in the recent Pursuit of "wicked smartness" in VS Code blog post. The post details the development of Copilot Chat agents, that behave as subject matter experts on code bases and technologies, and describes how extension authors will be able to contribute their own custom agents to VS Code.
Accessibility
Accessible View
Last iteration, we introduced automatic closing of the Accessible View when a key is pressed for a seamless flow between a UI component and its Accessible View. In some cases, this behavior might not be desirable and can now be disabled via the accessibility.accessibleView.closeOnKeyPress setting.
If you find yourself toggling between the terminal and the terminal's Accessible View, you might want to enable terminal.integrated.accessibleViewFocusOnCommandExecution, which automatically opens the Accessible View after a command is executed in the terminal.
Tooltips shown on keyboard focus
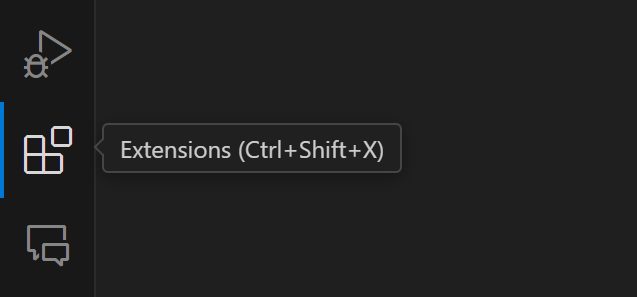
To improve the experience for keyboard users, tooltips are now shown on keyboard focus for items with custom hovers such as Activity Bar and Status Bar items.
Speech detection timeout
A new setting accessibility.voice.speechTimeout controls how long to wait during silence before accepting speech input, for example to Copilot Chat. By default, voice input is automatically submitted after 1.2 seconds of silence. You can set this to 0 to disable accepting speech input entirely.
Workbench
Floating editor windows
We are happy to announce that with this release you can move editors out of the main window into their own lightweight windows. Changes to an editor in one window apply immediately to all other windows where the editor is open.
The easiest way to create a floating editor window is to drag an editor out of the current window and drop it on an empty space on your desktop:
Theme: GitHub Dark (preview on vscode.dev)
The new workbench.editor.dragToOpenWindow setting can disable this behavior.
There are also new global and contextual commands to move or copy editors and editor groups into their own windows:
- View: Copy Editor into New Window (
workbench.action.editor.copyWithSyntaxHighlightingAction) - View: Move Editor into New Window (
workbench.action.editor.moveEditorToNextWindow) - View: Copy Editor Group into New Window (
workbench.action.editor.copyGroupToNextWindow) - View: Move Editor Group into New Window (
workbench.action.editor.moveGroupToNextWindow) - View: New Empty Editor Window (
workbench.action.newWindow)
The editor area in floating windows can be arranged with any complex layout that you want. And since both terminals and search results can be opened as editors, you can now have these features in separate windows as well!
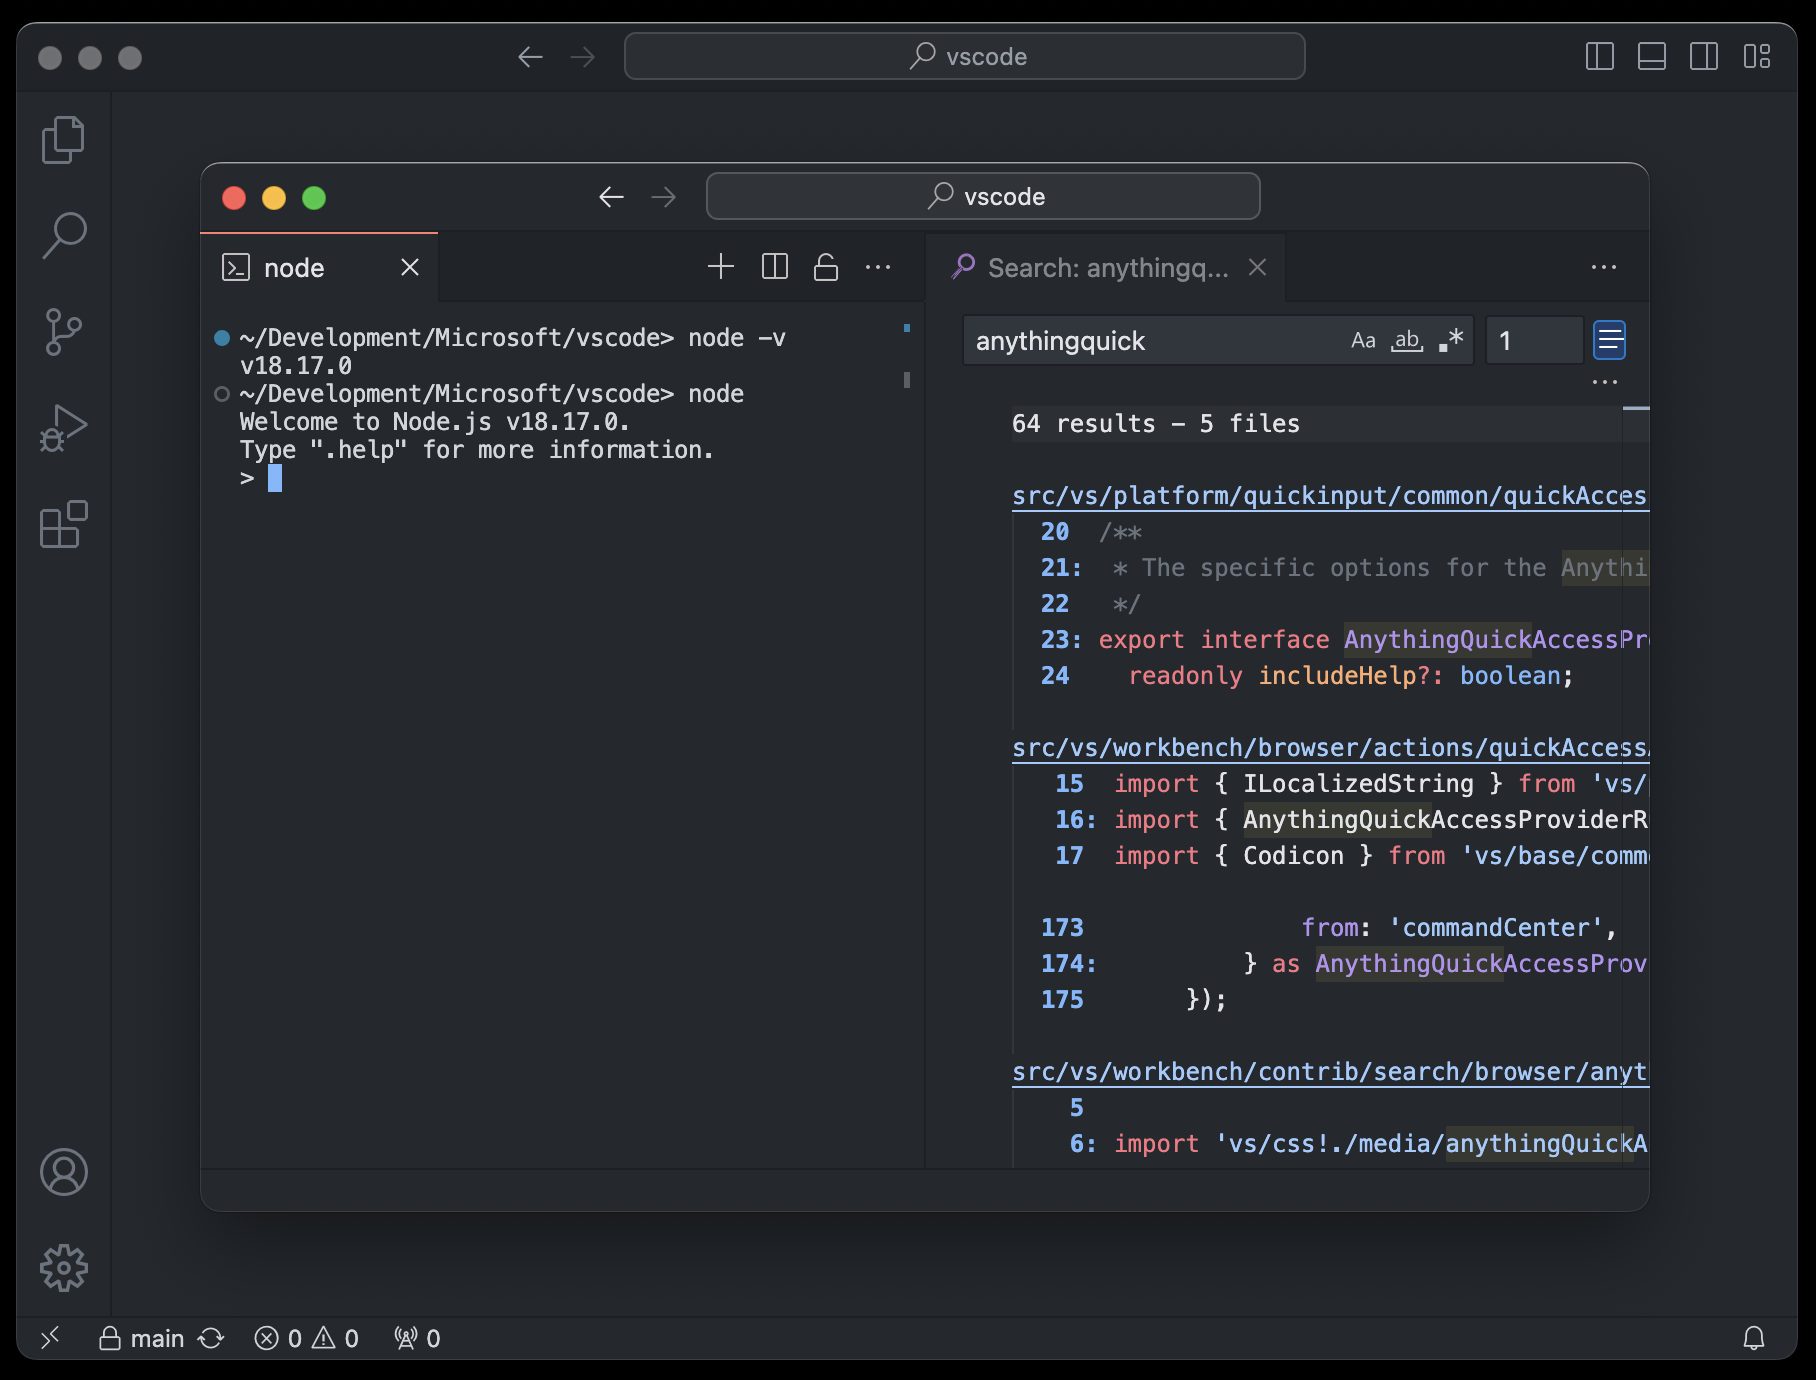
Give this new feature a try and report back any issues you encounter. Make sure to review our existing issues and cast your vote on missing features.
Native paste support in the File Explorer
VS Code now supports natively pasting files from your operating system's Explorer into the VS Code File Explorer.
Extension auto update control
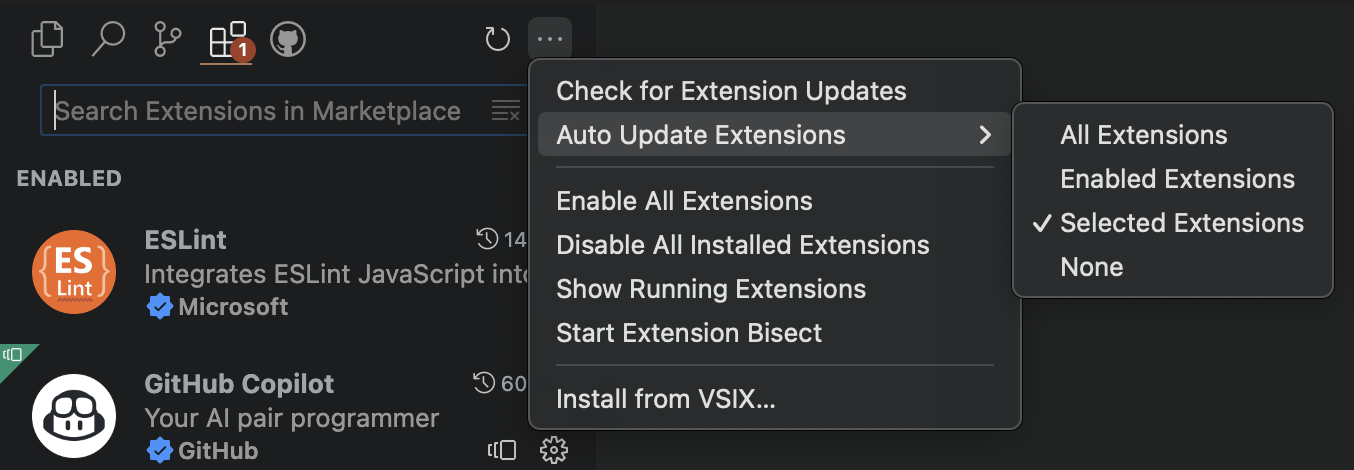
You can now choose which extensions to auto update. This is helpful if you do not want to auto update all extensions but selectively choose which ones to auto update. You can either select an extension or all extensions from a publisher. If you choose to auto update all extensions from a publisher, you can then unselect individual extensions from that publisher.
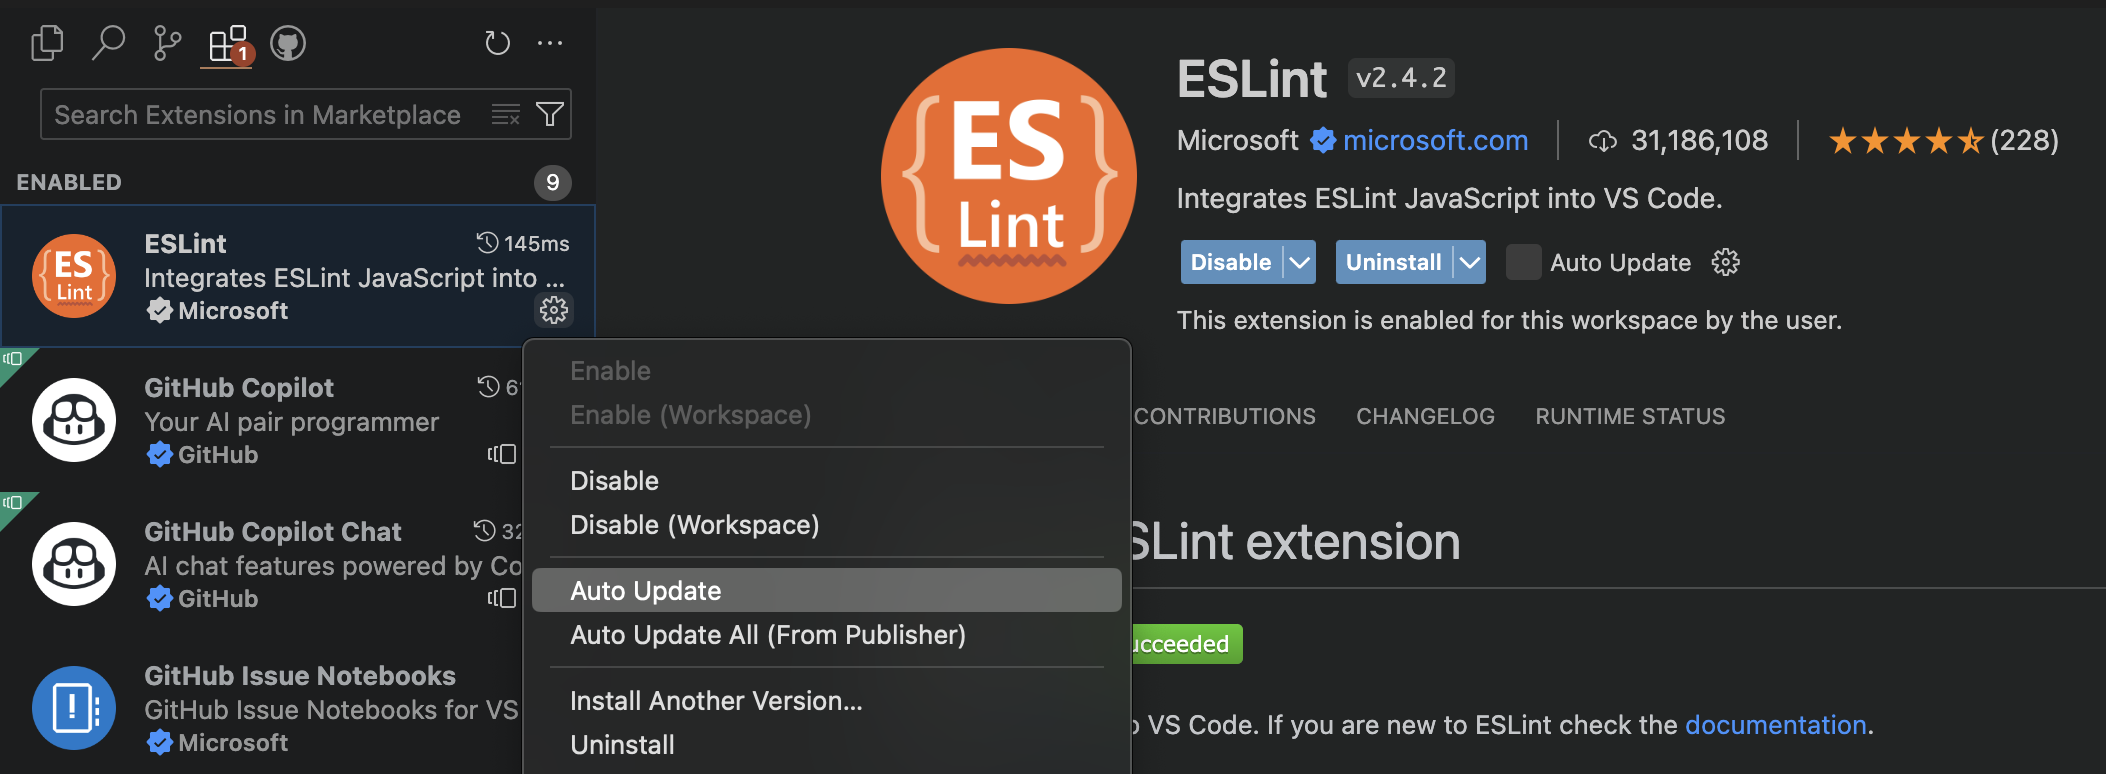
You should have auto updates either disabled (None) or enabled for selected extensions (Selected Extensions) to use this feature.
New Profile icons
The following new Profile icons are available to add to your profiles.
![]()
vrpianocoffeesnakerobotgamechipmusic
Settings editor search improvements and bug fixes
The Settings editor is back to sorting search results by match type first, rather than only by the table of contents. In other words, title and keyword matches show up at the top, so you don't have to scroll down to find a setting with a matching title.
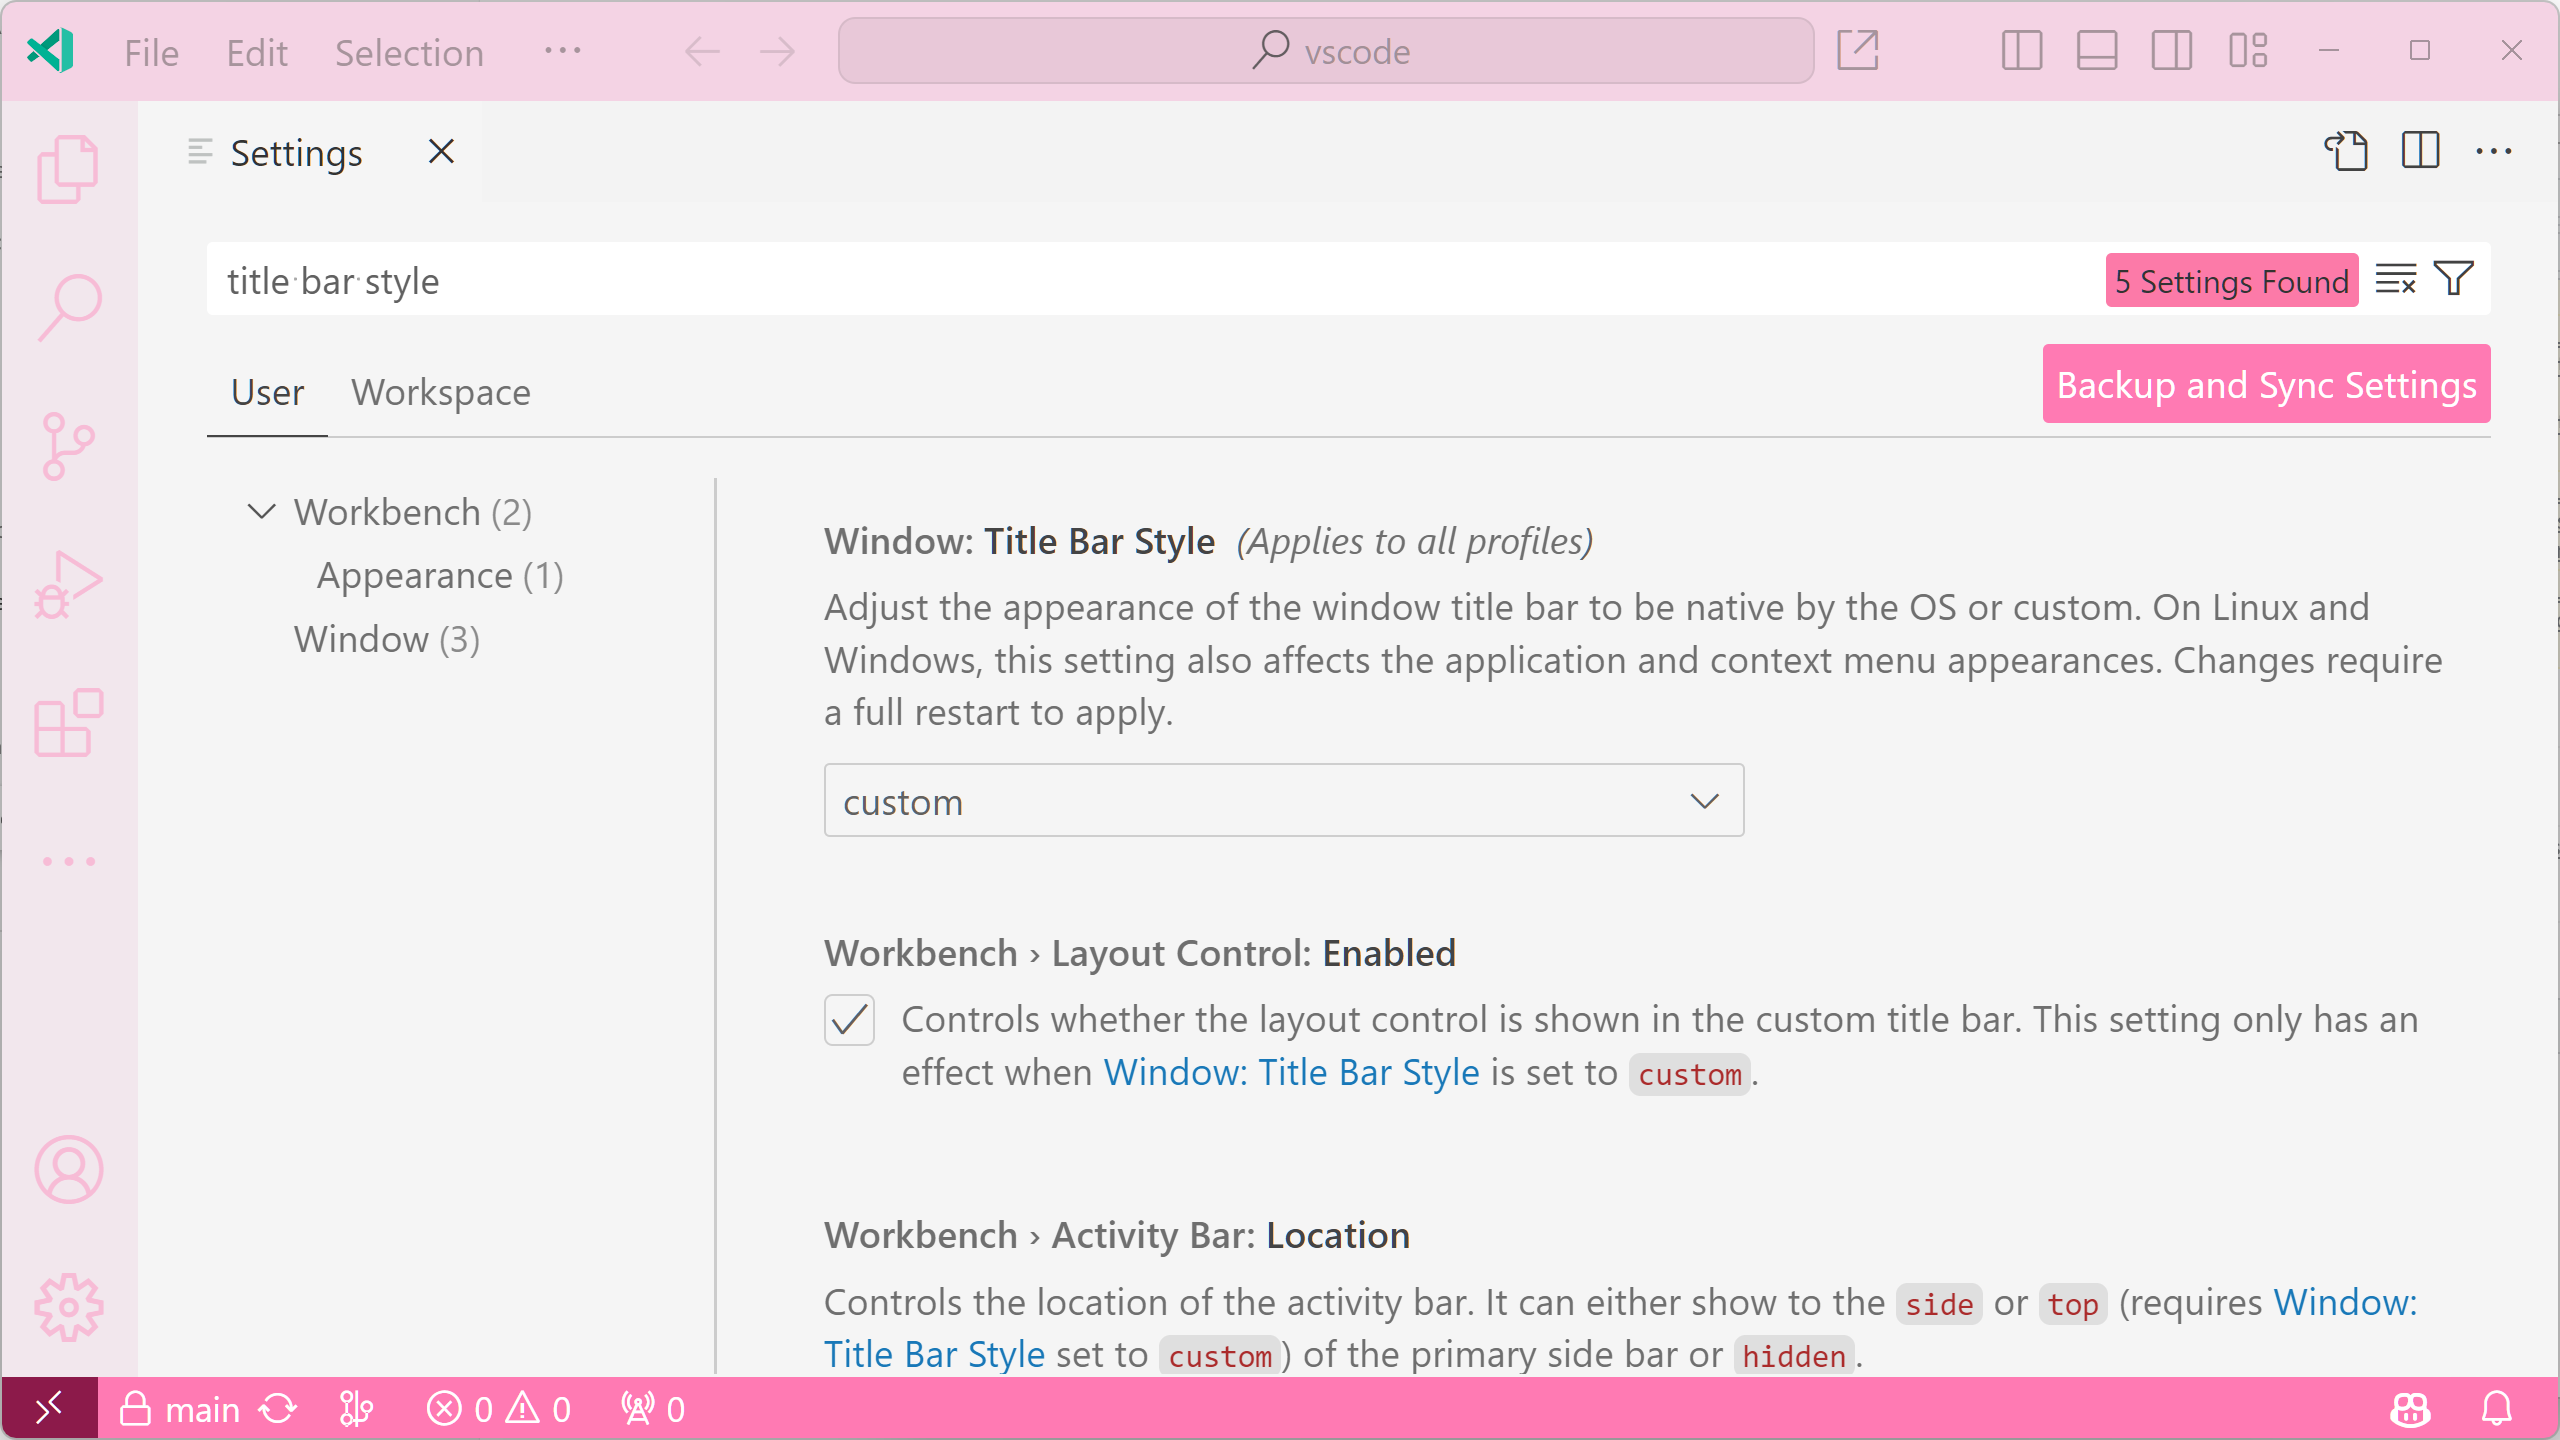
Theme: Light Pink (preview on vscode.dev)
The Settings editor still orders settings by the table of contents for tie-breakers, meaning that extension authors' order keys are respected for search queries such as @ext:<extension-id>.
Many Settings editor regressions were also fixed this iteration, including the Settings editor failing to load due to network issues and hanging on certain search queries.
Editor
Code Actions on Save and Auto
You can now enable Code Actions on Auto Save in the editor, and Editor: Code Actions On Save (editor.codeActionsOnSave) settings have been migrated over to corresponding enum values. When set to always, Code Actions can be run when you save or Auto Save with window change (onWindowChange) or focus change (onFocusChange). To enable this feature, check Editor: Code Actions On Save (editor.codeActionsOnSave) and change each Code Action's setting to always.
The setting value updates are as follows, with the previous boolean values to be deprecated in favor of the string equivalent.
The options are:
explicit- Triggers Code Actions when explicitly saved. Same astrue.always- Triggers Code Actions when explicitly saved and on Auto Saves from window or focus changes.never- Never triggers Code Actions on save. Same asfalse.
Multi document highlighting
Multi document highlighting has additional support from a new proposed MultiDocumentHighlightProvider API. There is now built-in support for semantic occurrence highlighting for the TypeScript language that can be enabled by changing the Editor: Occurrences Highlight (editor.occurrencesHighlight) setting value from singleFile to multiFile. For languages besides TypeScript, multi document occurrences are highlighted based off of textual occurrences rather than semantic occurrences until more language-specific providers are implemented.
Source Control
Incoming/Outgoing changes
This milestone we have introduced a new Incoming/Outgoing section in the Source Control view to display incoming and outgoing changes for the current branch compared to its remote. The new section displays both the individual changes with the number of resources changed along with insertions and deletions, as well as an All Changes entry that summarizes all resources across all changes. The visibility of the new section can be controlled using the scm.showIncomingChanges, and scm.showOutgoingChanges settings. Both settings support the following values: always, auto (default), and never.
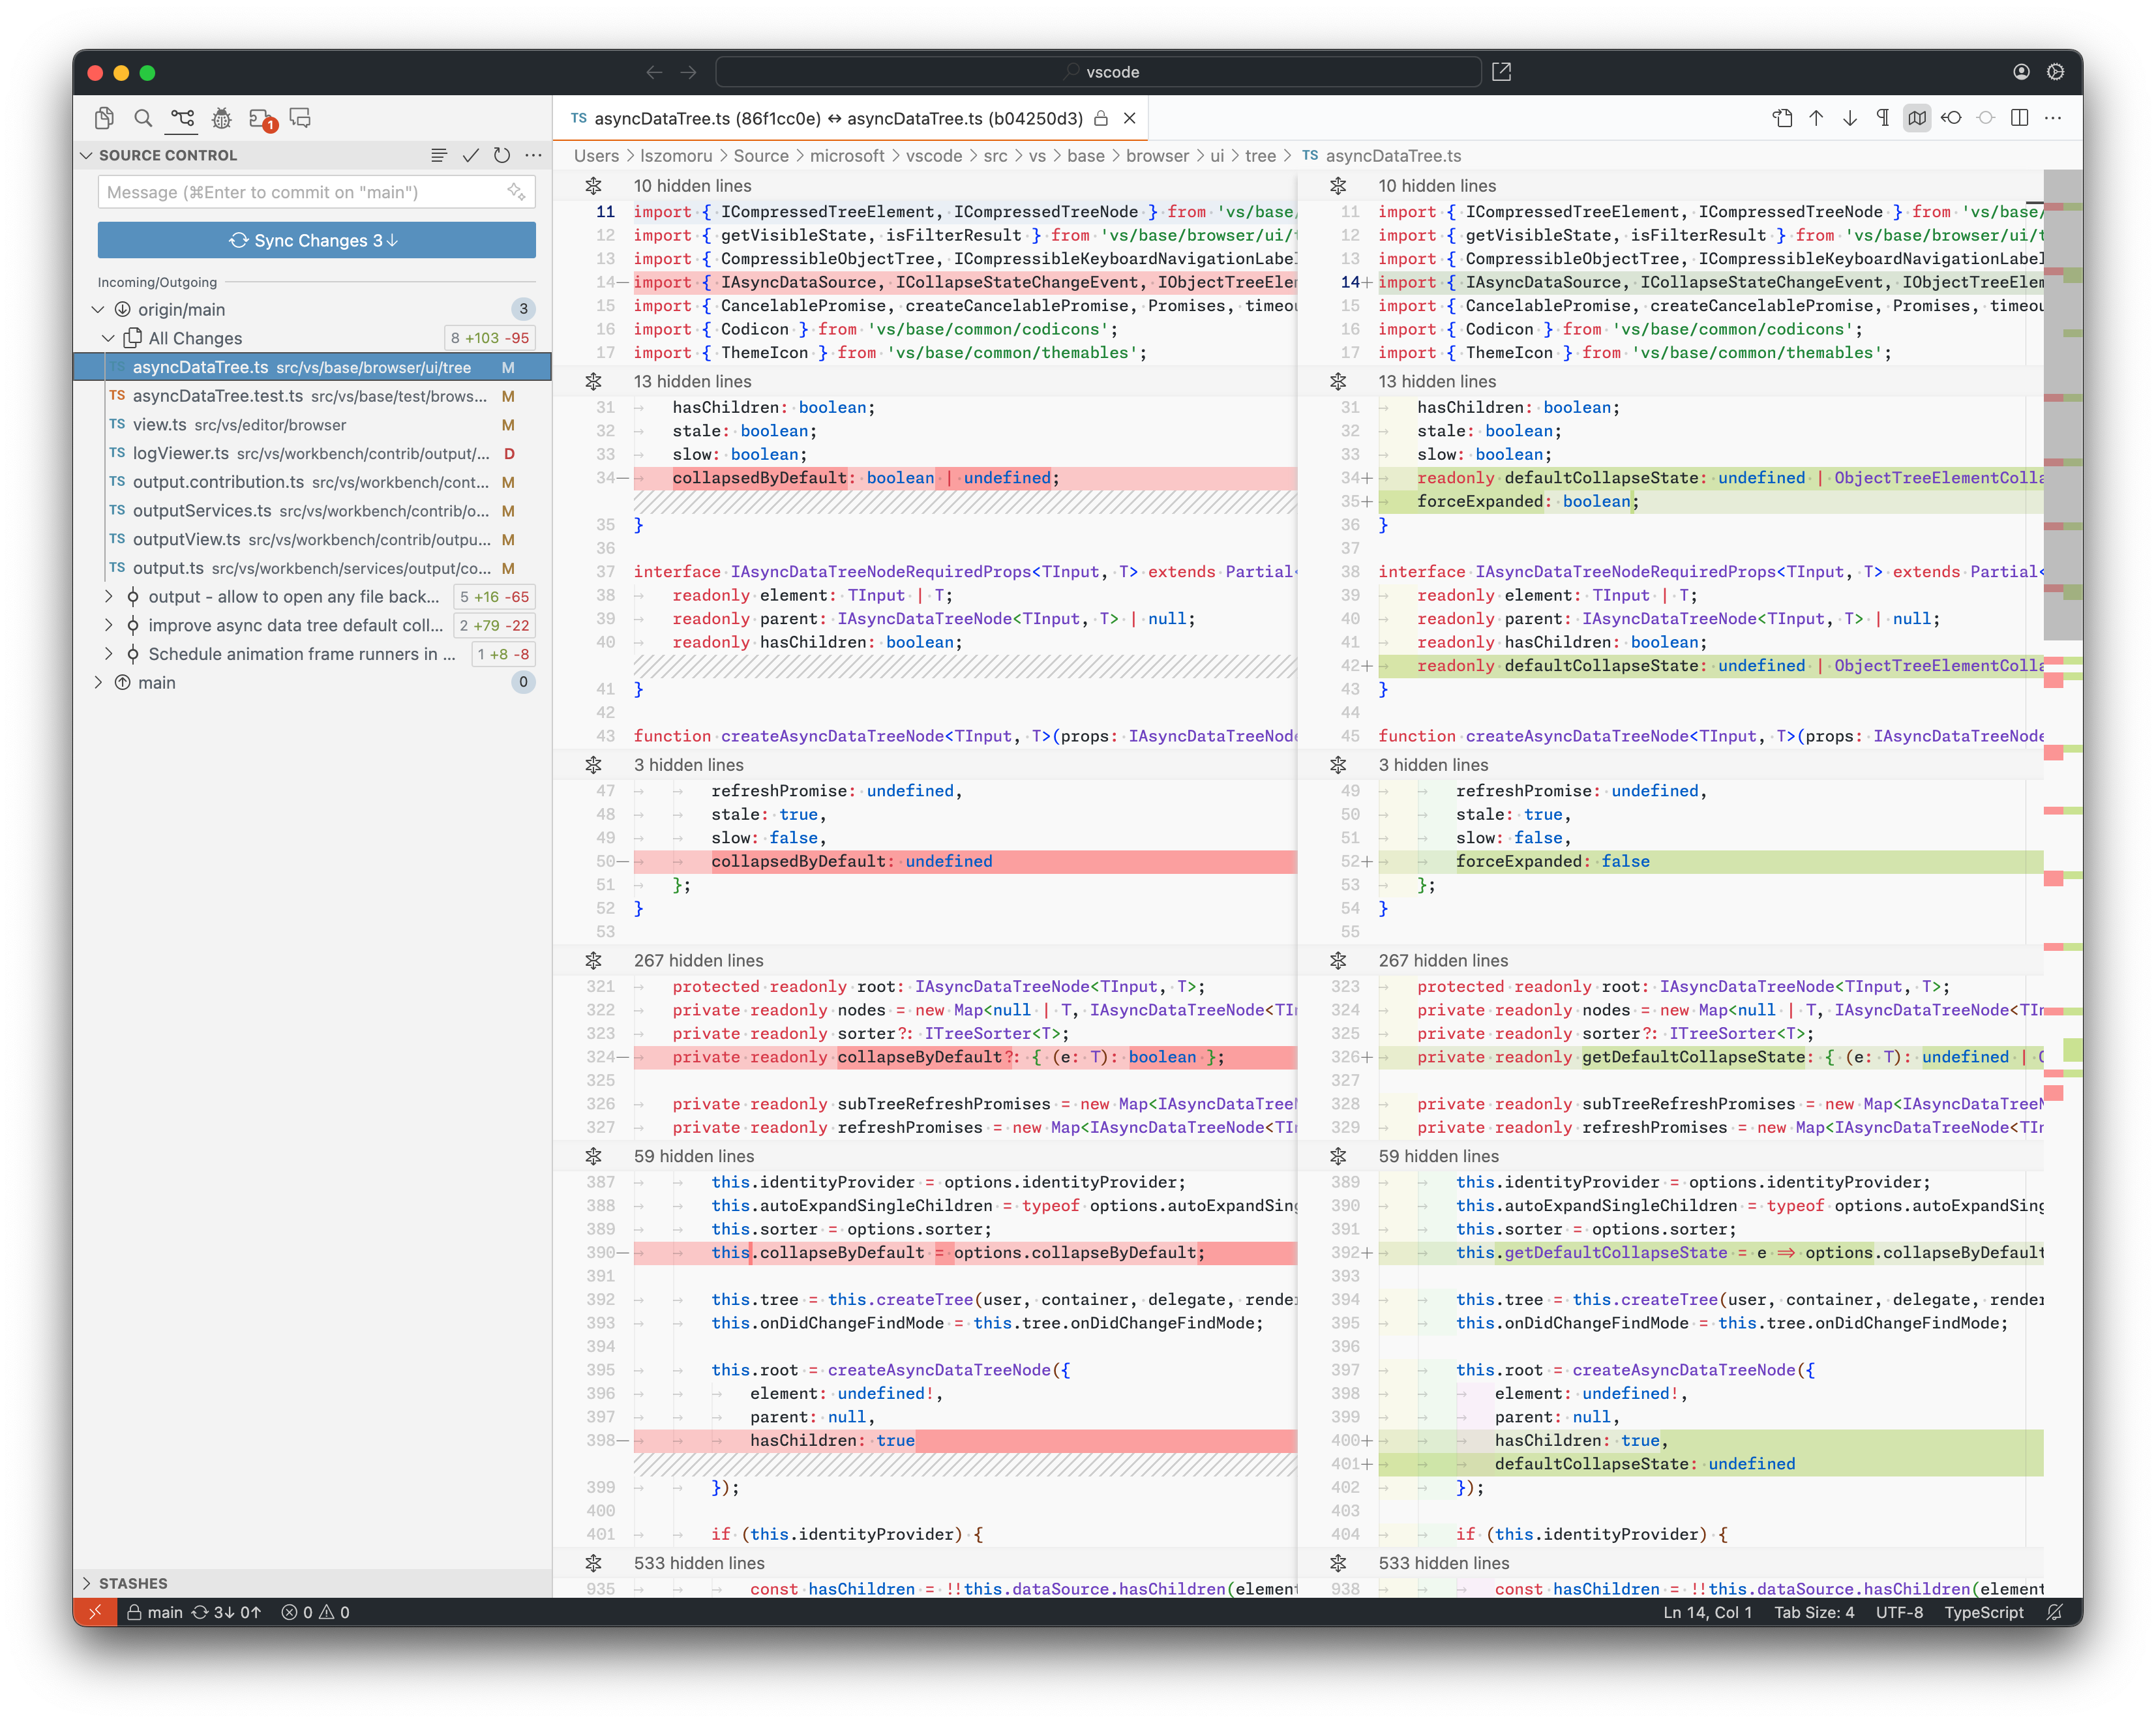
Input maximum lines
Previously, Source Control input would auto-grow to display at most 6 lines of text, which was sufficient space for most commit messages. However there were cases where more space would be helpful, and there is a new setting, scm.inputMaxLines, that controls the maximum number of Source Control input lines.
Terminal
Sticky scroll
Sticky scroll has landed in the terminal! Using knowledge provided by shell integration, the prompt of the command at the top of the viewport sticks to the top of the terminal, similar to how Sticky Scroll works in the editor.
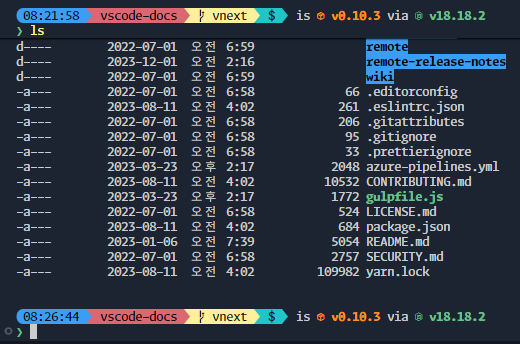
Clicking a Sticky Scroll element will scroll to that part of the terminal buffer.
This is currently disabled by default but can be enabled by setting "terminal.integrated.stickyScroll.enabled": true. We plan on enabling this by default in the future, at which point you will be able to opt out by right-clicking and toggling it off.
Command highlighting
Hovering a command in the terminal now shows a highlight bar to its left. This is useful for plain terminal prompts where it's not clear where one command starts and another ends.
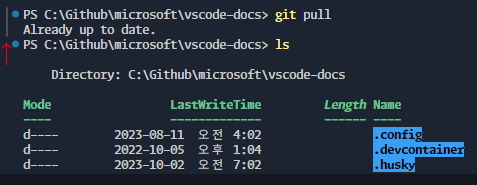
Shell integration and command navigation improvements
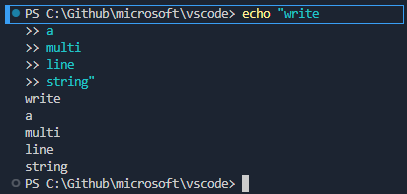
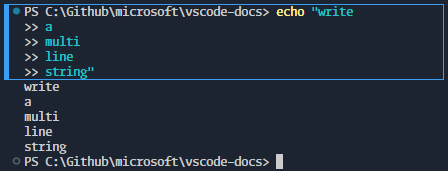
With the introduction of Sticky Scroll, many improvements were made to shell integration. In particular to terminals running on Windows, where the markers received from shell integration aren't totally reliable. There is now logic that intelligently scans the terminal contents and adjusts the markers before making the terminal command available.
Shell integration is also now capable of detecting the distinct parts of a prompt; the prompt and its input. This determines what part of the command displays when using Sticky Scroll. This will also trim empty lines from the top of the prompt, commonly used to split up output and make the terminal easier to read.
The existing command navigation feature also benefits as you can navigate to the more reliable prompt used for Sticky Scroll, rather than the less reliable prompt line.
Before:
After:
Improved underline rendering
Dashed and dotted underlines in the terminal are now rendered in a pixel perfect pattern:


Git pull Quick Fix
If a Git branch checkout can be fast forwarded, a new terminal Quick Fix provides the option to run git pull.
Tasks
The npm.packageManager setting can now be set to bun to enable detection and running of Bun scripts defined in package.json.
Debug
JavaScript Debugger
Visualize heap snapshots
V8 heap snapshots, saved as .heapsnapshot, can now be visualized in VS Code. There is both a traditional tabular view as well as a graphical representation of the retainers of a given memory object.
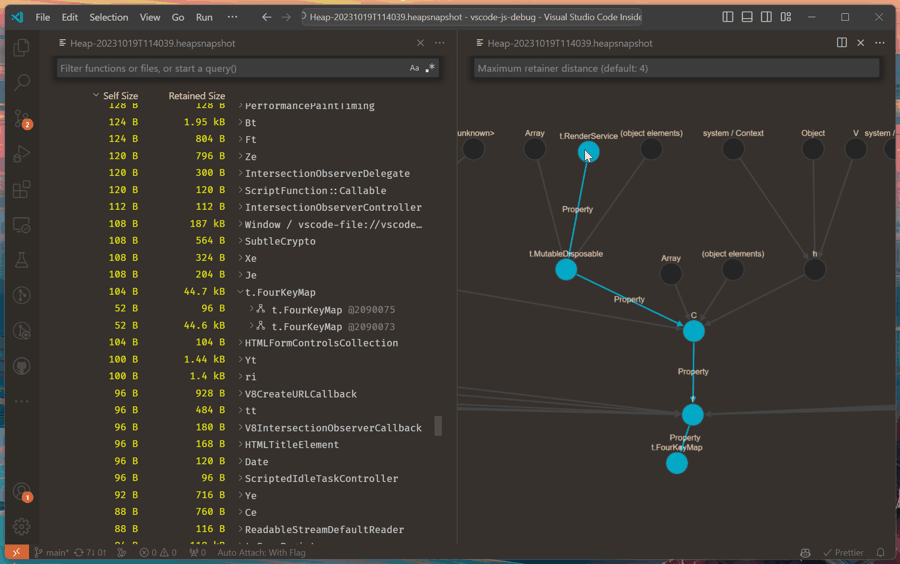
Theme: Codesong (preview on vscode.dev)
Heap snapshots can be captured using the Take Performance Profile command while debugging any JavaScript code. They can also be captured via the Memory tab in browser DevTools.
Improved Event Listener Breakpoints view
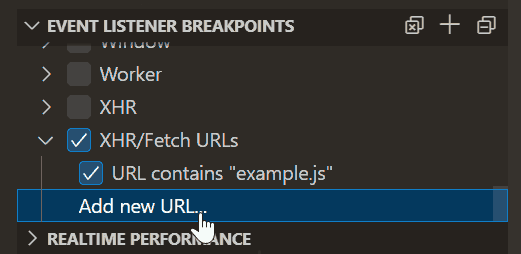
The Event Listener Breakpoints view, shown while debugging the Microsoft Edge or Google Chrome browsers, has been improved. It's now a checkbox list, and supports pausing on XHR/fetch requests based on the URL.
WebAssembly debugging with Rust
Both VS Code and wasm-bindgen made changes that allow Rust compiled to WebAssembly to be debugged in VS Code. See our documentation on WebAssembly debugging for more information.
Testing
The Find control is now supported in the Test Results view terminal.
Languages
TypeScript 5.3
This release includes TypeScript 5.3. This major update adds support for import attributes, better type narrowing, and more. It also includes new language tooling features and bug fixes.
You can read more about TypeScript 5.3 in the TypeScript blog.
node_module symbols excluded from workspace symbol search
Go to Symbol in Workspace now excludes symbols from node_modules by default. This makes it easier to find symbols in your code without getting overwhelmed by symbols from installed packages.
You can revert to the previous behavior that included all symbols in the project by setting "typescript.workspaceSymbols.excludeLibrarySymbols": false.
Jump to definition for inlay hints
Types in JavaScript and TypeScript inlay hints are now interactive. Quickly jump to a type's definition by hovering over the type and clicking while holding Ctrl on Windows and Linux or Cmd on macOS:

Prefer using 'type' for auto imports
Type-only imports let you import a type while ensuring the import gets fully erased at runtime. If you prefer to always default to type imports, you can now set "typescript.preferences.preferTypeOnlyAutoImports": true and auto imports will use type-only import. This setting is off by default.
Remote Development
The Remote Development extensions, allow you to use a Dev Container, remote machine via SSH or Remote Tunnels, or the Windows Subsystem for Linux (WSL) as a full-featured development environment.
Highlights include:
- Automatically install the GitHub Copilot and Pull Requests and Issues extensions in Dev Containers.
- Finer control over which extensions are installed in Dev Containers.
- Reuse local machine certificates in local Dev Containers and WSL sessions.
You can learn more about these features in the Remote Development release notes.
Contributions to extensions
GitHub Copilot
Inline chat UI improvements
The inline chat prompt history is now persisted across VS Code sessions. The keyboard shortcuts to see the previous and next prompts were also changed to be Up and Down to align with other previous and next item shortcuts in VS Code.
When inline chat proposes creating new files, such as when using the /test slash command, you can now choose the file name and location by selecting Create As from the Create drop down.
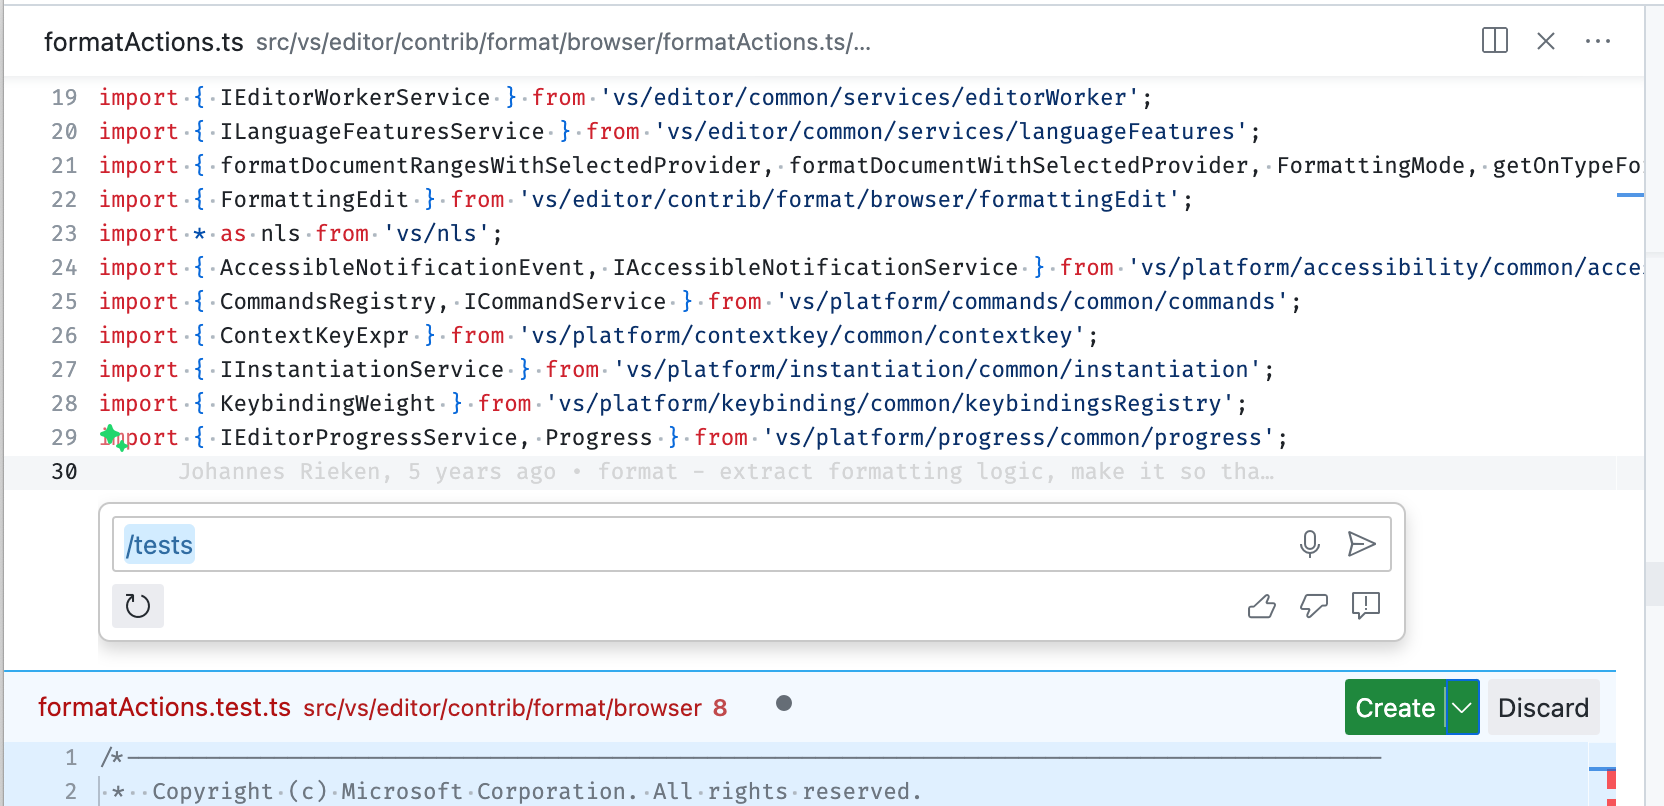
Last, there is a new experimental lightweight UI mode for inline chat. It provides a smoother streaming experience and renders diffs only on demand. You can enable it via the "inlineChat.mode": "live3" setting.
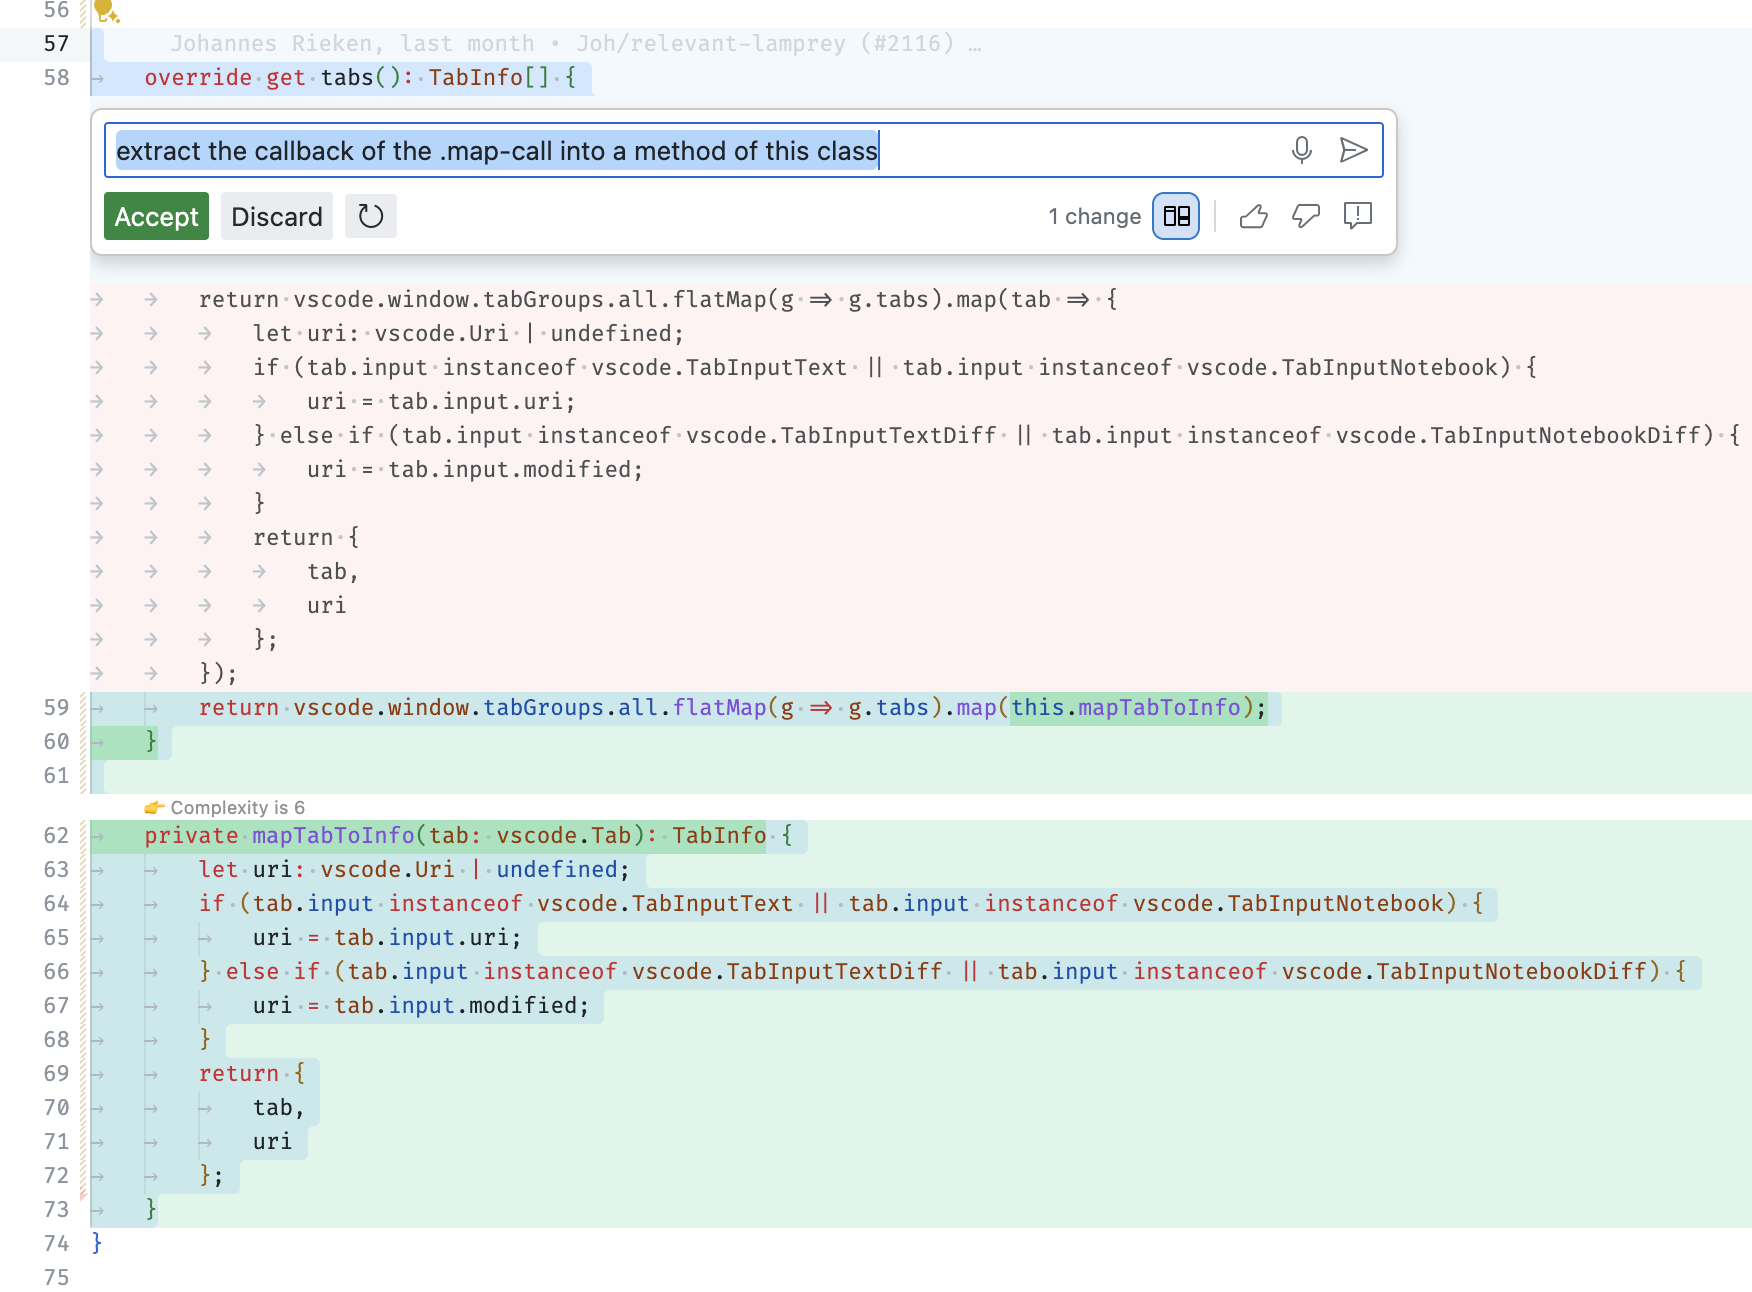
Inline chat for fixes shows summary and follow-up action
When using inline chat for fixes (/fix), you now also get a short summary what the fix does. If there are remaining errors, you can refine the fix by clicking on the offered follow-up action.

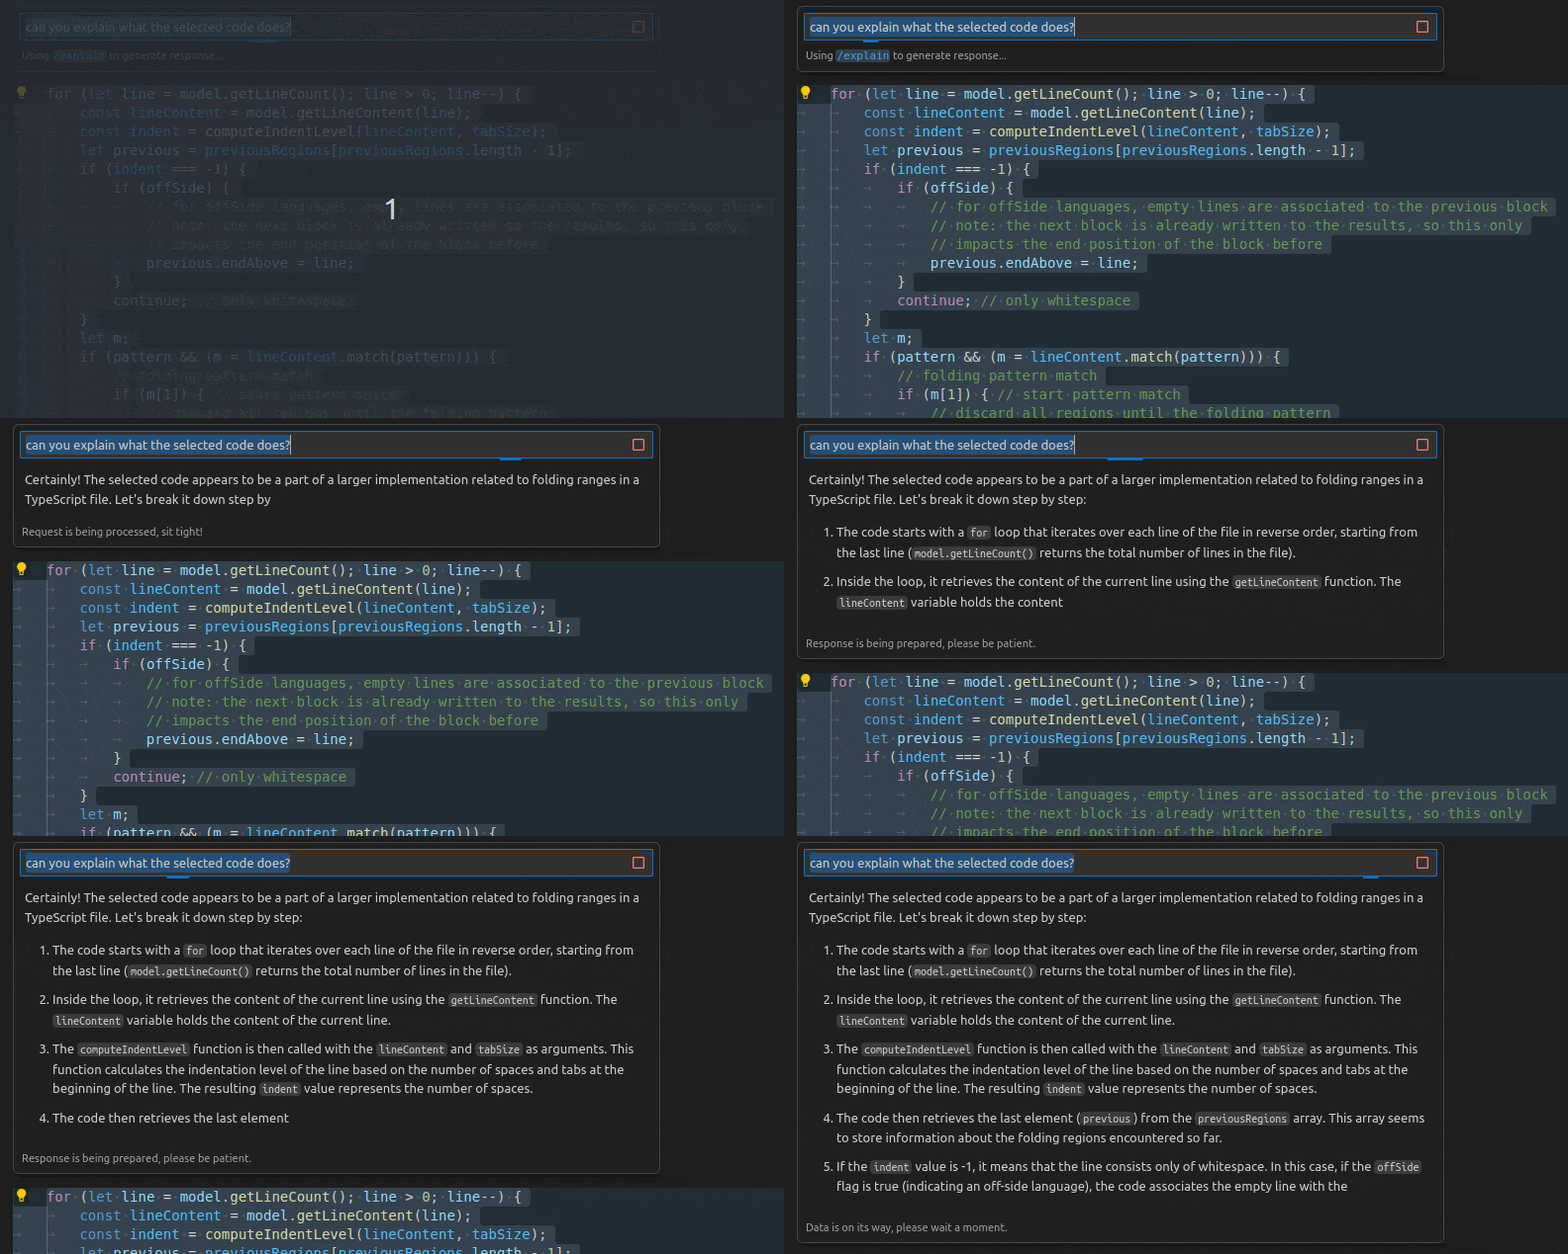
Progressive message rendering in inline chat
Inline chat now uses the same progressive rendering as the Chat view:
Terminal generate commit message Quick Fix
Last release, a Copilot Generate Commit Message "sparkle" was added to the Source Control view input box. For terminal users, there is now a Quick Fix to generate an editable commit message in the terminal after running the git add... command.
Terminal agent and command suggestion improvements
All terminal related features have moved to the @terminal agent. This was done to make it clear that the terminal agent might not pull in workspace information, to consolidate the functionality, and make it more convenient to use.
Here are the mappings from the old to new prompts:
| Old | New |
|---|---|
@workspace /terminal how do I list files? |
@terminal how do I list files? |
@workspace /explain #terminalSelection |
@terminal #terminalSelection |
@workspace /explain #terminalLastCommand |
@terminal #terminalLastCommand |
In addition, command suggestions saw significant improvements this release. Terminal command suggestions now know about the operating system and the shell used. Workspace information is also conditionally pulled in, based on whether Copilot thinks the question is related to the workspace. The workspace context collection should see further improvements, both in terms of speed and what exactly gets referenced.
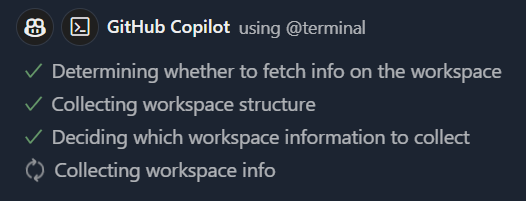
Notice in this example how the @terminal agent knows how file paths are formed when used in the microsoft/vscode repository:
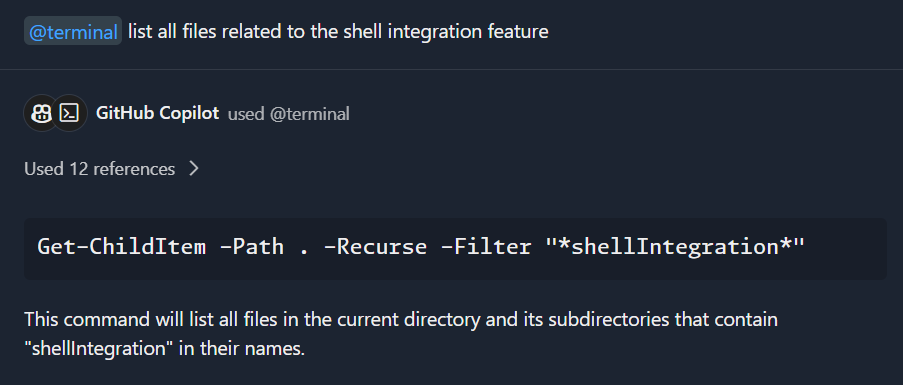
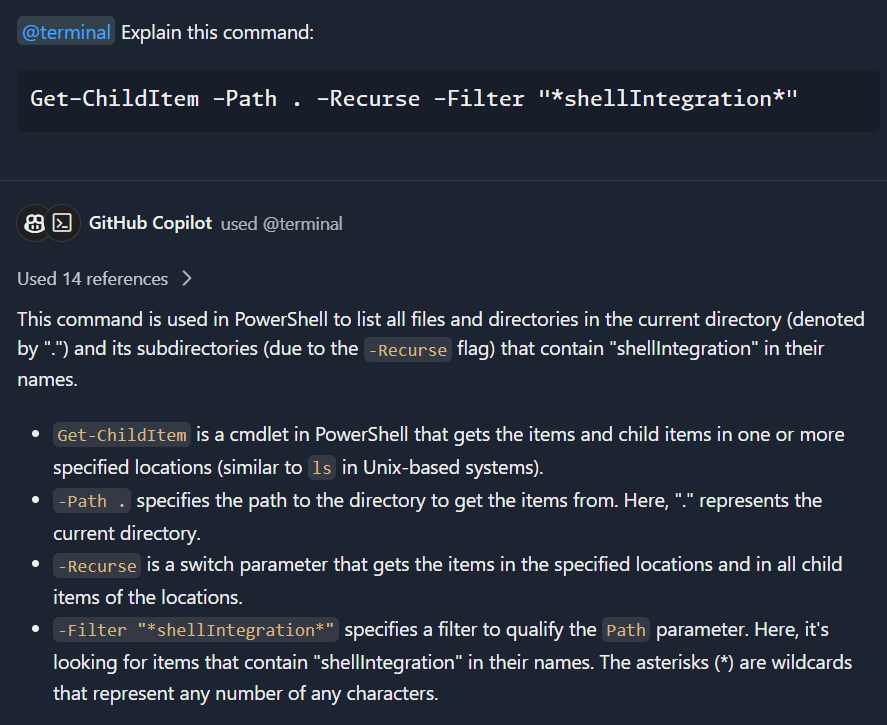
There are also convenient follow-ups to explain suggested commands, which are presented as blue sparkle links just above the chat input box:

Activating the Explain follow-up gives a detailed explanation of the suggested command:
Authentication upgrade dialog when using GitHub remote search capabilities on private repos
If enabled for your user account, when you use the @workspace agent, Copilot Chat searches your workspace using remote search capabilities. In order to use remote search with private repositories, an authentication token with more permission is required. If there isn't a token with the needed permissions already, you are prompted for additional permission:
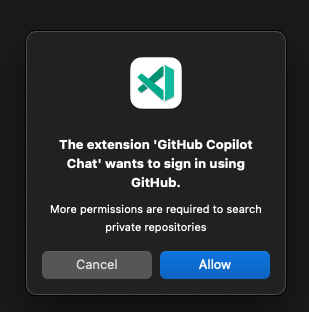
You'll only see this dialog one time and future queries to the @workspace agent will use the cached token.
Send a request to @workspace more easily
Since the @workspace agent is used in many Copilot queries, we wanted to make sure it's as easy as possible to activate. You can now type a question in the chat input, then press to send the question and automatically prepend @workspace.
Explain Rust code with Copilot
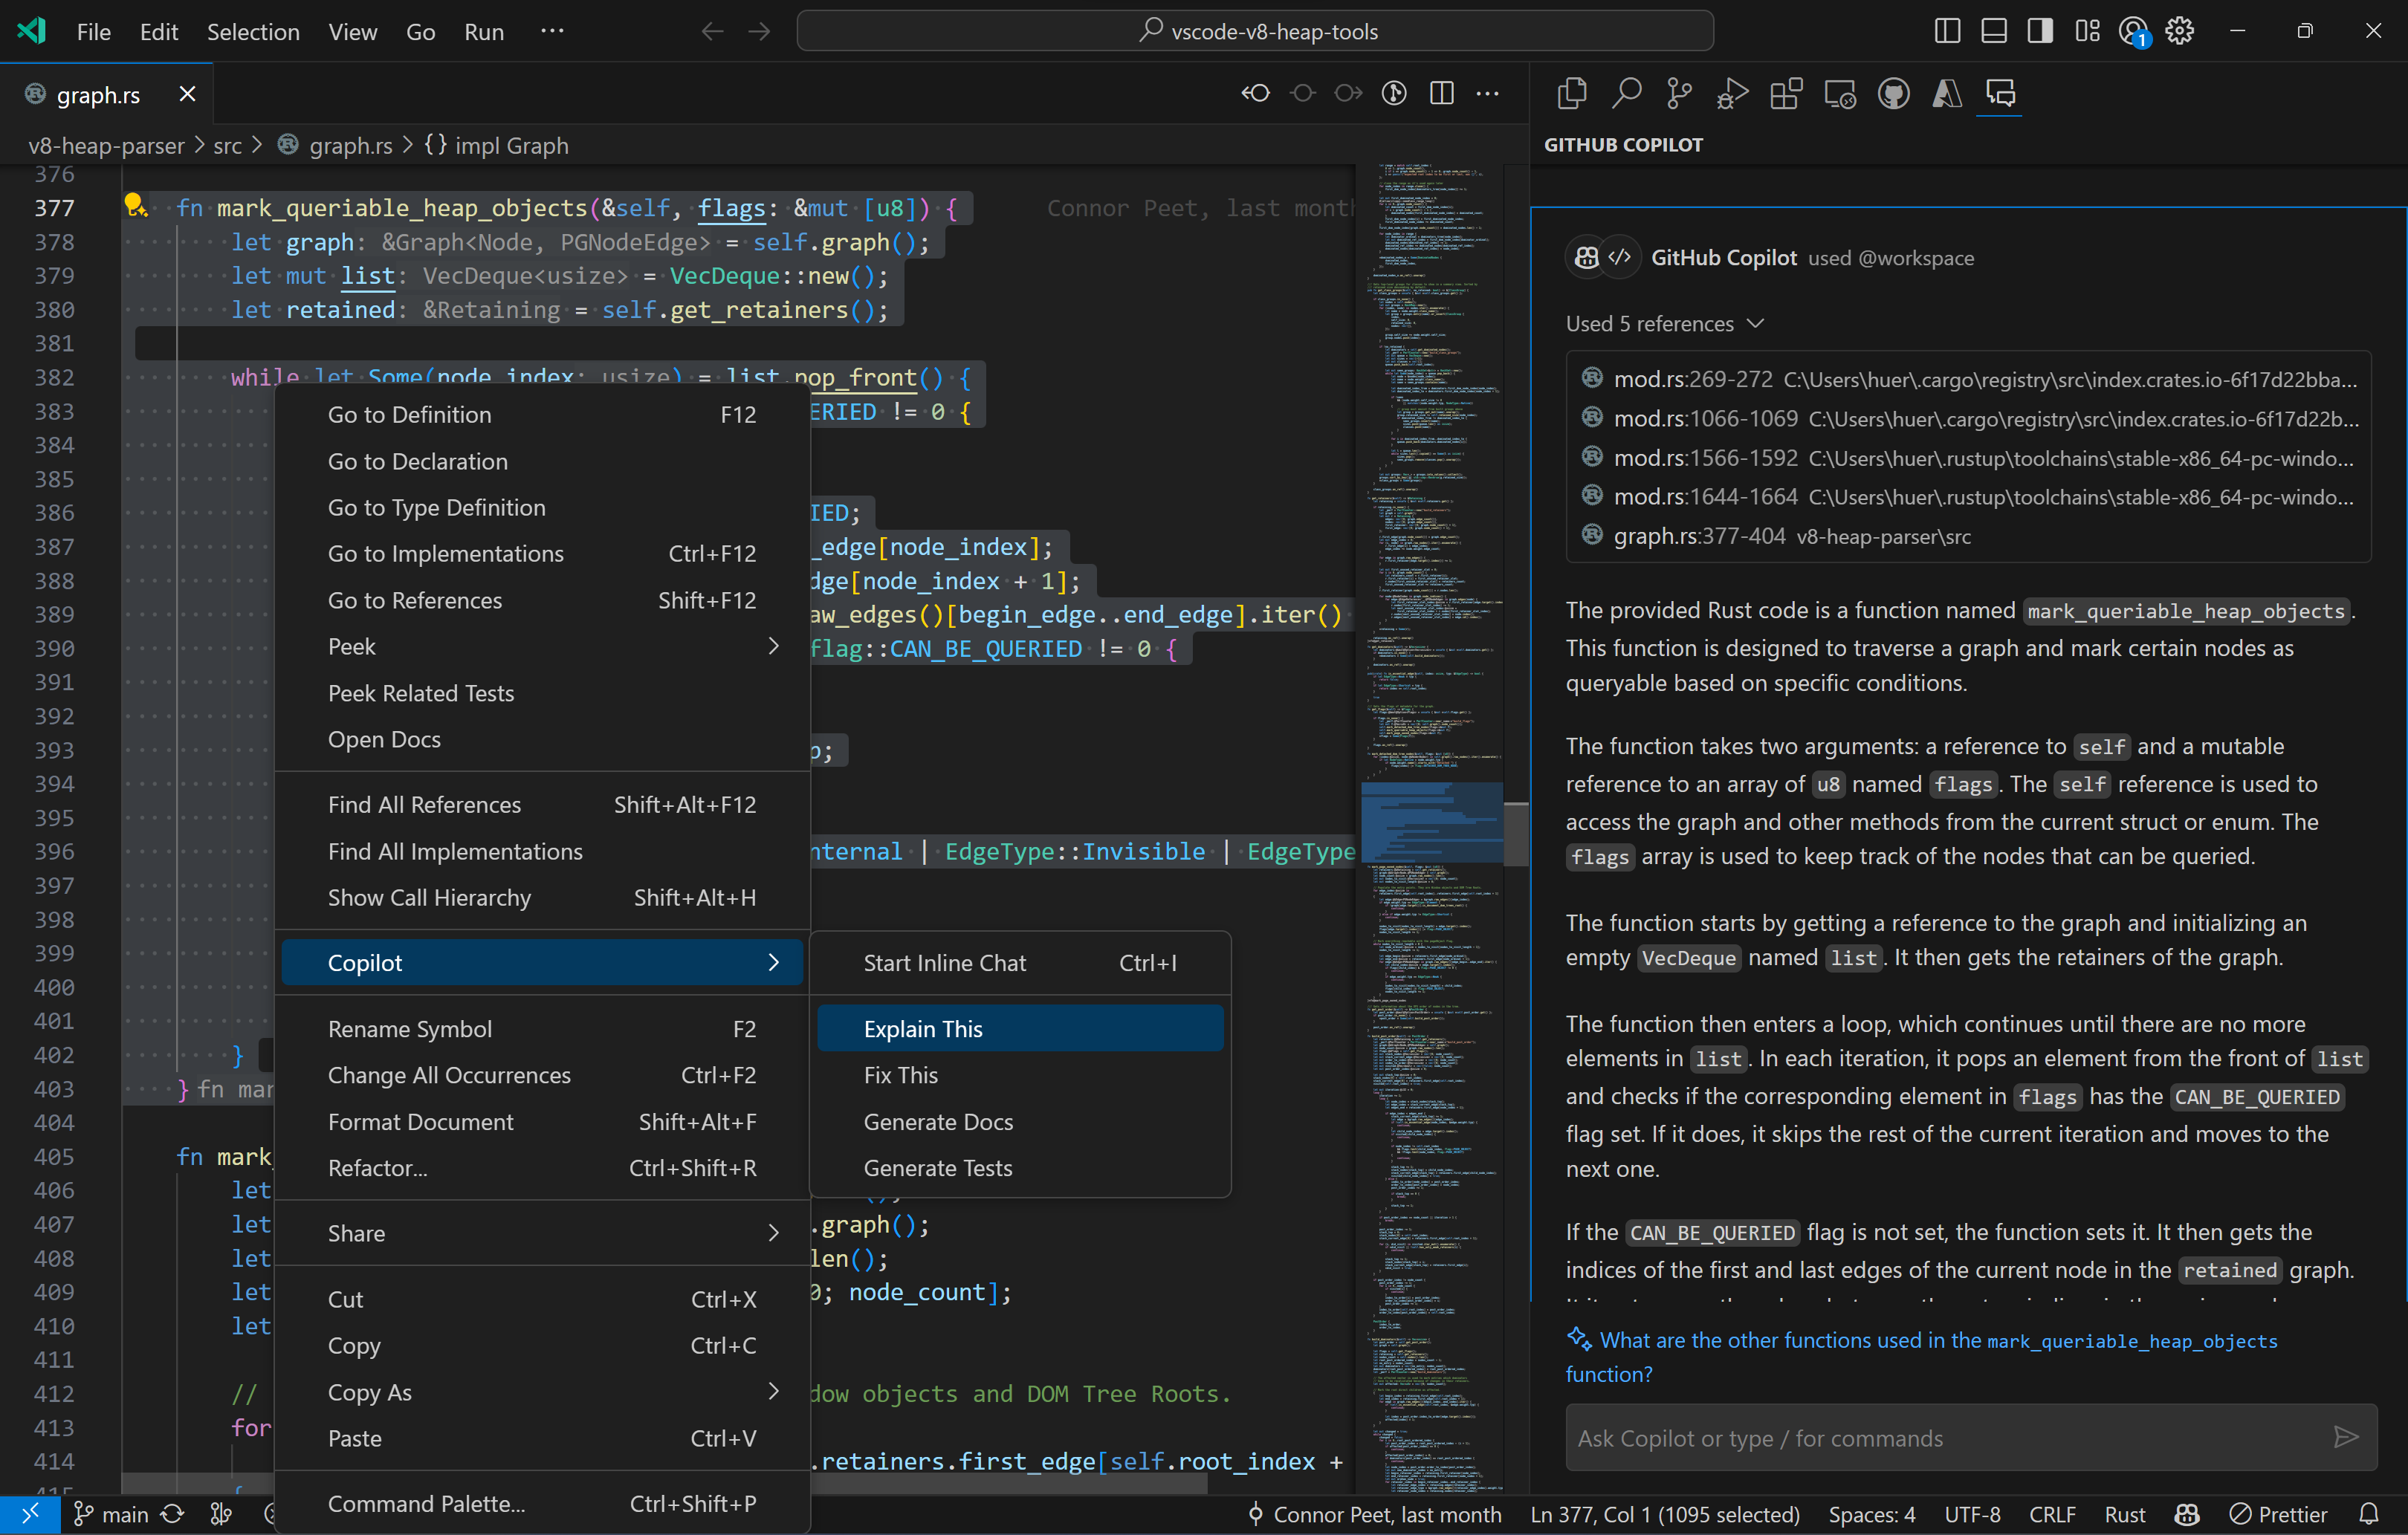
Copilot Chat now collects cross-file context from your codebase when you ask it to explain Rust code and have a Rust language service extension installed such as rust-analyzer. To view a Copilot explanation, select some code in your active editor, then use the Copilot > Explain This from the context menu or /explain from inline chat or the Chat view.
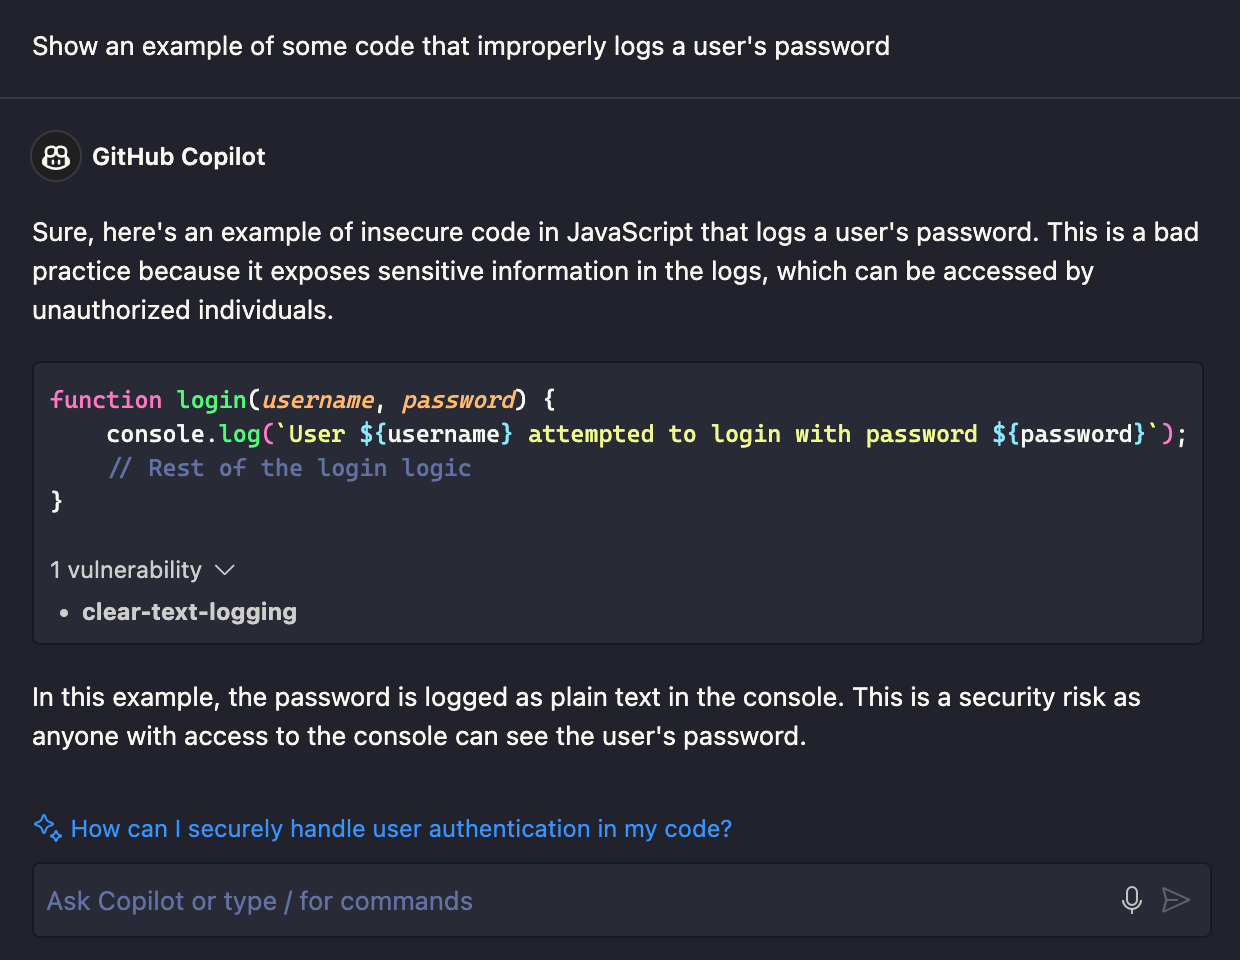
Potential vulnerability detection in code blocks
We want to make sure that you are aware of any possible issues with Copilot generated source code, so we are now running code in Chat view codeblocks through a code vulnerability detection model and flagging any detected issues. You might not see this feature at first, but we will be gradually rolling it out to Copilot Chat users, and also tuning the types of vulnerabilities that are detected.
When a codeblock is determined to contain a possible vulnerability, it will be annotated at the bottom of the codeblock. The vulnerability detection model is one we're piloting, so be sure to make your best determination when reviewing Copilot's suggestions and any potential vulnerabilities.
Copilot videos and livestream sessions
Don't miss the recent VS Code Copilot videos on YouTube. Learn about the latest Copilot Chat features and how Copilot "just got a whole lot smarter".
And if you haven't been tuning in to the VS Code livestreams, you'll want to watch the Copilot demos featured in the 1.84 release party.
Python
Show Type Hierarchy with Pylance
You can now more conveniently explore and navigate through your Python projects' types relationships when using Pylance. This can be helpful when working with large codebases with complex type relationships.
When you right-click on a symbol, you can select Show Type Hierarchy to open the type hierarchy view. From there you can navigate through the symbols' subtypes as well as supertypes.
Theme: Catppuccin Macchiato (preview on vscode.dev)
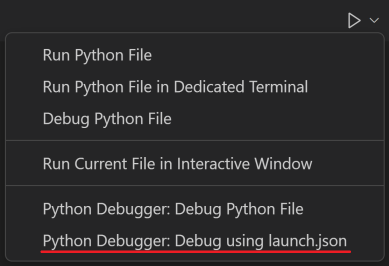
Configurable debugging option under the Run button menu
The Python Debugger extension now has a configurable debug option under the Run button menu. When you select Python Debugger: Debug using launch.json and there is an existing launch.json in your workspace, it shows all the available debug configurations that you can pick to start the debugger. If there aren't any configurations, you are prompted to select a debug configuration template to use to create a launch.json file for your Python application.
Deactivate command supported when activated using environment variables
The Python extension has a new activation mechanism that activates the selected environment in your default terminal without running any explicit activation commands. This is currently behind an experimental flag and can be enabled through the following User setting: "python.experiments.optInto": ["pythonTerminalEnvVarActivation"].
However, one initial drawback with this activation mechanism is that it didn't support the deactivate command. We received feedback that this is an important part of some users' workflow, so we have added support for deactivate when the selected default terminal is PowerShell or Command Prompt. We have plans to add support for additional terminals in the future.
Warning message and setting for REPL Smart Send
When attempting to use Smart Send via Shift+Enter on a Python file that contains invalid or deprecated code, there is now a warning message and an option to deactivate REPL Smart Send. Users can change their user and workspace specific behavior for REPL Smart Send via the Python.REPL: Enable REPLSmart Send (python.REPL.enableREPLSmartSend) setting.

Testing architecture rewrite
The Python test adapter rewrite experiment has been rolled out to 100% of users. Currently, you can opt out by adding "python.experiments.optOutFrom" : "pythonTestAdapter" in your settings.json, but we will soon drop this experimental flag and adopt this new architecture.
GitHub Pull Requests and Issues
There has been more progress on the GitHub Pull Requests and Issues extension, which allows you to work on, create, and manage pull requests and issues.
- Merge queues are now supported in the PR description and Create view.
- A new setting
"githubPullRequests.allowFetch": falsepreventsfetchfrom being run. - Submodule support was improved.
Review the changelog for the 0.78.0 release of the extension to learn about the other highlights.
Preview Features
Sticky Scroll in trees
Building on the success of Sticky Scroll in the editor, we've extended this feature to all tree views, enabling users to more easily navigate project trees. Sticky Scroll for trees can be enabled by setting workbench.tree.enableStickyScroll: true. To ensure Sticky Scroll does not take too much space, it can only take up to 40% of the view height. Additionally, users can customize the maximum number of sticky elements by configuring workbench.tree.stickyScrollMaxItemCount, which is set to 7 by default.
For an improved tree navigation experience, you can select a sticky element to jump directly to it within the tree, or press the chevron of a parent element to hide all its child elements. Additionally, accessing checkboxes and action items is easier when Sticky Scroll is enabled.
Multi-file diff editor
This release ships a preview of the multi diff editor. The multi diff editor lets you view changes in multiple files in one scrollable view:
To enable the multi diff editor, set "multiDiffEditor.experimental.enabled": true. Currently, the multi diff editor can be used to review local changes, staged changes, incoming/outgoing changes, and changes from pull requests. Note that the multi diff editor is not yet feature complete and might not work in all scenarios.
Alternate character filtering for Korean
For various features across the workbench that use filtering, VS Code will now also search the QWERTY keyboard equivalent as it's common to accidentally forget to switch the language Input Method Editor (IME). This works similar to search engines but in real time. For example, debug when typed in a Korean IME is ㅇ듀ㅕㅎ, which is nonsensical:
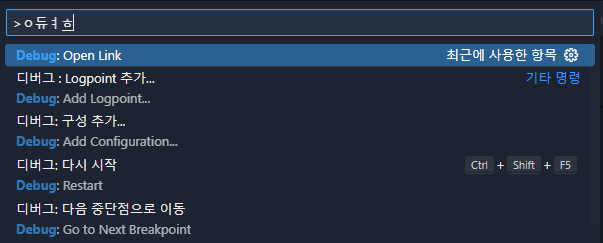
Currently this does not work when filtering from the middle of the word.
Hide Problem decorations
There is a new setting to hide Problem decorations in the editor and throughout the workbench (excluding the Problems view). The setting Problems: Visibility (problems.visibility) is enabled by default to show all problems.
Some Problems UI settings are disabled when Problems: Visibility is off:
- Outline > Problems: Badges (
outline.problems.badges) - Outline > Problems: Colors (
outline.problems.colors) - Outline > Problems: Enabled (
outline.problems.enabled) - Problems > Decorations: Enabled (
problems.decorations.enabled)
A warning is shown in the Status Bar when Problems: Visibility is off.

Proposed APIs
Every milestone comes with new proposed APIs and extension authors can try them out. As always, we want your feedback. Here are the steps to try out a proposed API:
- Find a proposal that you want to try and add its name to
package.json#enabledApiProposals. - Use the latest @vscode/dts and run
npx @vscode/dts dev. It will download the correspondingd.tsfiles into your workspace. - You can now program against the proposal.
You cannot publish an extension that uses a proposed API. There may be breaking changes in the next release and we never want to break existing extensions.
Test coverage
This iteration we revived work on test coverage, with initial UI integration and some minor updates to the longstanding proposal. While the API is too lengthy to include here, we believe it to be fairly straightforward, and would welcome your input on the proposal in issue #123713.
Chat Agents
As mentioned in our recent blog post, Pursuit of "wicked smartness" in VS Code, we are developing a model for extensions to contribute chat agents to the Copilot Chat view. The chat agent API is proposed, but you can experiment with adding your own chat agent now. Subscribe to issue #199908 for updates.
Multi document highlighting API
As introduced in the previous release, there is now support for multi document highlighting within VS Code. This iteration, we added a proposed MultiDocumentHighlightProvider API to register multi document highlight providers. This adds the ability to provide semantic occurrence highlighting for specific programming languages. Providers return a new MultiDocumentHighlight structure with a Map of URI to DocumentHighlight. Feedback and further updates can be tracked via issue #196354.
Engineering
New CDN
We're rolling out the deployment to a new CDN endpoint: vscode.download.prss.microsoft.com. For system administrators, make sure to configure network rules to allow traffic from this endpoint.
macOS 10.13 and 10.14 support has ended
VS Code 1.85 is the last release that supports macOS 10.13 (macOS High Sierra) and 10.14 (macOS Mojave). Refer to our FAQ for additional information.
Notable fixes
- 195796 Searching for text after localization is not supported in the Settings editor
- 197319 vscode://file// links no longer working
- 194094 Do not dismiss Profiles Icon picker when moving mouse outside of the picker
- 197070 Support positioning debug toolbar on custom title bar
Thank you
Last but certainly not least, a big Thank You to the contributors of VS Code.
Issue tracking
Contributions to our issue tracking:
Pull requests
Contributions to vscode:
- @a-stewart (Anthony Stewart): Simplify
'solid' || ''in viewPaneContainer.ts PR #198515 - @abhijit-chikane (Abhijit Chikane): treeStickyScroll change default value to boolean PR #198849
- @amaust (Andrew Maust): Adds "verified domain" identifier to url tooltip PR #197037
- @andrewbranch (Andrew Branch)
- Add setting for preferring type-only imports PR #196123
- [typescript-language-features] Add missing preference description for preferTypeOnlyAutoImports PR #197403
- @arvid220u (Arvid Lunnemark)
- fix blank settings page PR #198261
- Update condition names to allow node PR #198274
- @cobey (Cody Beyer)
- Add missing py azure packages PR #195508
- Cobey add missing js PR #197600
- @d-mahard (Dipta Mahardhika): chore: rename color var for comment input box PR #197950
- @elseifthen: Display line numbers in front of search results (#_190742) PR #195452
- @gjsjohnmurray (John Murray)
- Add 'Lock Group' button on aux windows (#_182265) PR #182294
- Support condition and hit count on data breakpoints (fix #188721) PR #195710
- Remove redundant task system message and early return affecting FSPs (fix #192490) PR #196247
- Avoid empty or ambiguous repository label in Repositories submenu (fix #196613) PR #196623
- Add
typescript.implementationsCodeLens.showOnInterfaceMethodssetting (#_136282) PR #198419 - Remove obsolete migration code for Timeline setting PR #198542
- Add 'Collapse All Diffs' action button to multi-diff editor PR #199064
- Multi-diff editor: add Expand All Diffs action PR #199623
- @gtritchie (Gary Ritchie): aria-hide search icon PR #197577
- @hamirmahal (Hamir Mahal): feat: allow keyboard shortcut creation for terminal copy commands PR #197099
- @hsfzxjy (Xie Jingyi)
- @installed matches extension description PR #196602
- Set cursor when clicking "Show Previous/Next Change" PR #197501
- Add inlineSuggest.showToolbar.never PR #198227
- @idootop (Del): feat: introducing new hover focus options for editor.action.showHover PR #196891
- @jsoref (Josh Soref): Write out
CannotPR #198377 - @jtbandes (Jacob Bandes-Storch): Update Swift grammar and upstream repository PR #197470
- @marrej (Marcus Revaj): # Fix Suggest dropdown/inline completion partial accept (via next token/line) race PR #197633
- @marvinruder (Marvin A. Ruder): Add Bun as package manager to
npmextension PR #198005 - @mrgharabaghi (Mohammad Reza Gharabaghi): Update theme-defaults PR #197449
- @myty (Michael Tyson): Use Extension Provided Terminal Profile from Context Menu PR #195108
- @n-gist (n-gist): Add pinned tab button (icon) control setting PR #196896
- @nolddor (Jack Nolddor): fix: missing translation for new-empty-windows desktop action PR #199129
- @noritada (Noritada Kobayashi): Fix an issue that \xN8 and \xN9 in Rust strings are incorrectly colored PR #196198
- @oxcened (Alen Ajam): fix: do not hide hover on model content change of editor PR #198100
- @PrathamLalwani: added voice chat listening duration feature PR #197801
- @r3m0t (Tomer Chachamu): [Acc] Keyboard accessible tooltips- Fixes #132344 PR #197965
- @rehmsen (Ole)
- Layout when switching from welcome to terminal. PR #173368
- Remove cycle browserHostService.ts -> web.api.ts. PR #198221
- Make xtermTerminal.test.ts hermetic. PR #198403
- @remcohaszing (Remco Haszing): Increase the target of Monaco from es6 to es2018 PR #192050
- @ronakj (Ronak Jain): Fix tsconfig resolution for navigation PR #192851
- @scripthunter7 (David): Add TMLanguage aliases to YAML PR #198300
- @SimonSiefke (Simon Siefke)
- feature: allow to paste files from the clipboard PR #195730
- fix: memory leak in dropdown action PR #197769
- fix: memory leak in comments controller PR #198237
- @tisilent (xiejialong)
- Add mousedown,contextmenu events to terminal find PR #194817
- Delete hide assignment in _adoptConfiguration* PR #197526
- @WardenGnaw (Andrew Wang)
- Show Dynamic Configuration Providers with No Context (file opened) PR #196768
- Add support for running DebugConfigurations with serverReadyAction PR #197597
- @zobo (Damjan Cvetko): fix: invalid endCharacter value in built in PHP validation provider PR #196166
Contributions to vscode-css-languageservice:
- @dyhagho (Dyhagho Briceño): [scss] Path resolver to include partial files support PR #373
Contributions to vscode-pull-request-github:
- @flpcury (Felipe Cury): Fix deprecation messages for createDraft and setAutoMerge PR #5429
- @gjsjohnmurray (John Murray): Treat
githubIssues.useBranchForIssuessetting description as markdown (fix #5506) PR #5508 - @kurowski (Brandt Kurowski): add setting to never offer ignoring default branch pr PR #5435
- @ThomsonTan (Tom Tan): Iterate the diffs in each active PR in order PR #5437