Develop agents with Agent Inspector in Foundry Toolkit
When an agent returns an unexpected answer, the response alone might not explain what went wrong. Agent Inspector in Foundry Toolkit for VS Code lets you send requests to a local agent, inspect model and tool activity, and debug your code before deploying a change.
This is useful when developing a hosted agent: an agent you build in code and deploy to Microsoft Foundry Agent Service. You maintain its logic and dependencies, while Foundry manages the hosting infrastructure. Use local inspection to debug your agent code before deployment. Before production use, also test the deployed agent with its runtime identity, configuration, and network access. For a comparison with prompt agents, see Choose an agent type.
In this article, you connect to a local agent, investigate a request, and preserve diagnostic events for further analysis. The main path uses the Responses protocol for conversational requests. The available views depend on the protocol and the diagnostics your agent server provides.
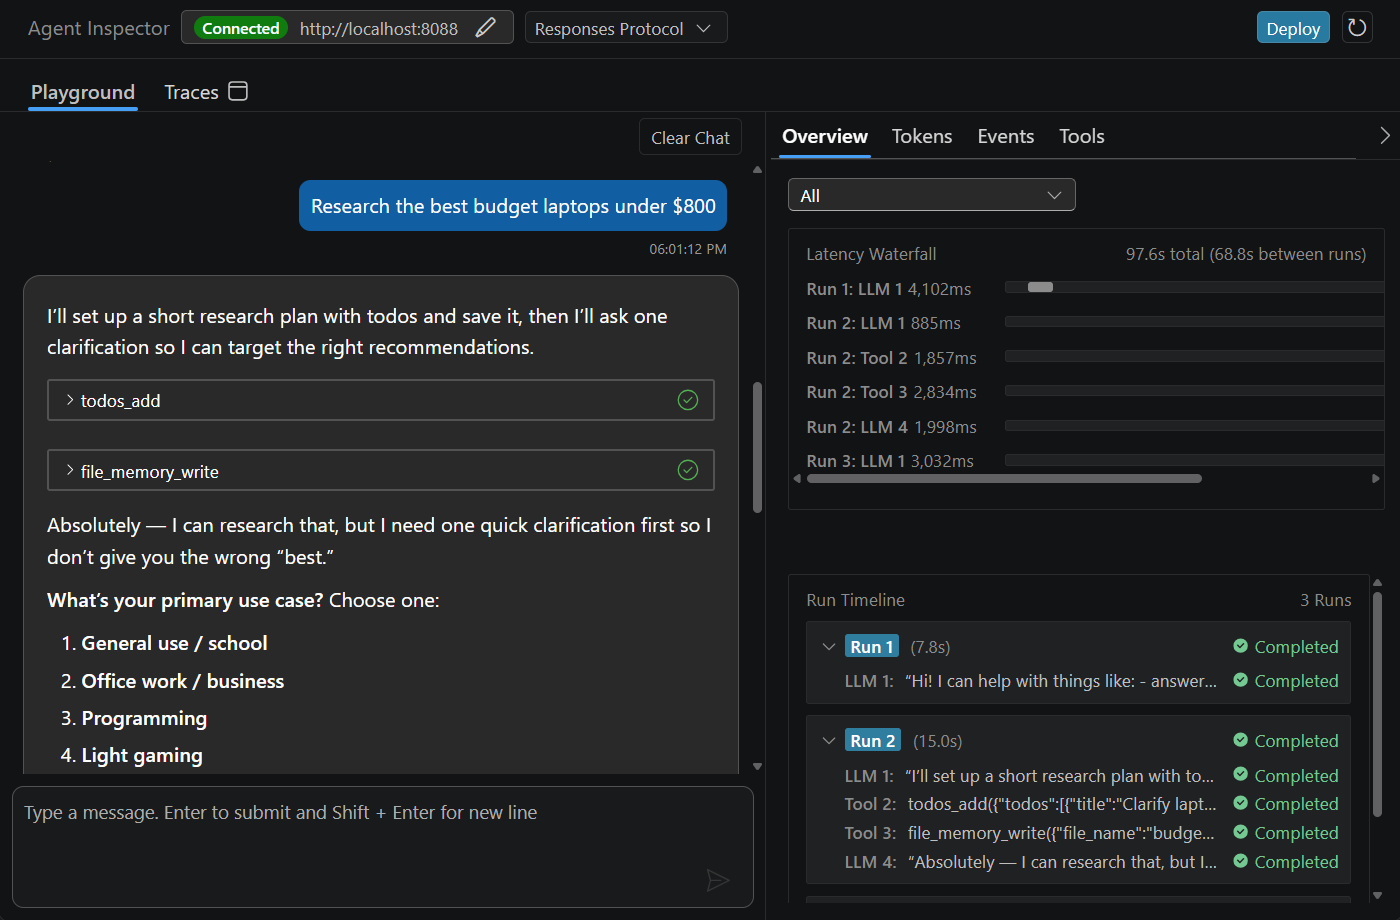
The following example shows a local Responses agent with tool calls, a latency waterfall, and a run timeline.
Prerequisites
- Visual Studio Code with the current public Foundry Toolkit extension. See Install Foundry Toolkit.
- A local agent project with its dependencies, model configuration, and credentials set up. To start from a sample, follow Create and deploy a hosted agent through its local testing section.
- The debugger required by your project. The Python sample uses the Python extension and
debugpy. Other languages and samples have different requirements.
For help adapting an existing project, use the Foundry Toolkit Copilot tools. Review the generated configuration and follow the project's README.md rather than replacing its launch files with a generic configuration.
A local agent can call cloud models and live tools. Use non-sensitive test inputs, check tool permissions, and account for charges from the configured services. Inspector doesn't replace tools with mocks.
Connect and debug
Start the agent server before connecting Inspector. Use your project's generated launch configuration to ensure that the server, working directory, interpreter, and debugger are all aligned.
- Start your agent using its documented debug configuration. For the hosted-agent Python sample, follow Run and test locally. Its Debug Local Agent HTTP Server configuration opens Inspector when you press F5.
- If Inspector isn't open, select Foundry Toolkit in the Activity Bar, then Developer Tools > Build > Agent Inspector.
- Check the endpoint in the Inspector header. The current Python scaffold uses
http://localhost:8088. If your server uses a different port, select the pencil button beside the endpoint, enter that port, and select Connect. - Confirm that the header shows Connected. When the endpoint is reachable, Inspector automatically detects the Responses or Invocations protocol. You don't need to select it manually.
- Set a breakpoint in your agent code, send a message in the playground, and use the debugger to inspect variables when execution pauses. After continuing, review the response and diagnostics as described in Use the Inspector.
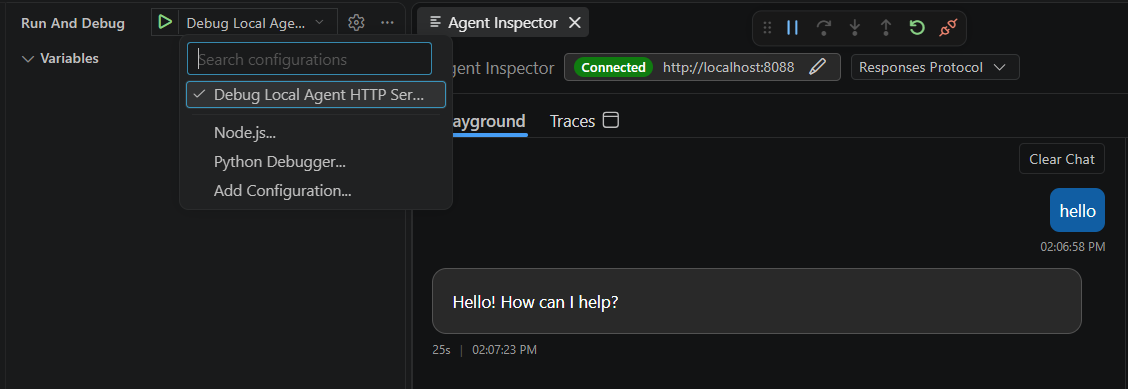
Opening Inspector alone doesn't launch a server or attach a debugger. The generated Python configuration uses port 5679 for the debugger and port 8088 for agent HTTP requests. These are separate from the OTLP tracing ports described in Tracing in Foundry Toolkit.
Generic Responses endpoints
Inspector can connect to a local generic Responses endpoint without the full development diagnostics interface. You can inspect the Responses events the server sends, but the workflow graph and its input and output view aren't available. A successful connection doesn't mean the server supplies source locations, token usage, or reasoning.
Send an HTTP invocation
Use HTTP Invocations when your agent accepts a custom request body rather than a conversational message. The server's request format and response protocol determine how Inspector sends and displays the result.
- Connect to your running HTTP Invocations server. Inspector detects the protocol automatically.
- Enter the request body required by your agent. When the server exposes a compatible OpenAPI specification, Inspector can fill in an example. Review that example before sending it, and follow the sample's request format if no example is available.
- Select the Request settings gear beside the input to set Content-Type and Accept as required by the server. For example, use
application/jsonfor a JSON body andtext/event-streamas the accepted response type when the server supports streaming. - Select Send and inspect the response status and body.
- Switch between Preview for formatted output and Raw for the underlying response. The Invocations details pane also includes I/O and LLM Calls. Model, tool, and token details depend on recognized events from the server, so not every response fills every tab.
Inspector handles a normal HTTP response, a stream of server-sent events, or an asynchronous response. For an asynchronous 202 Accepted response, Inspector polls the invocation until it completes or fails. Selecting a response format doesn't add streaming or asynchronous support to your server.
For a streaming response, Stop disconnects the client stream. For a polled invocation, Cancel sends a cancellation request to the server. Neither action guarantees that the agent process or an external tool operation has stopped.
This view isn't a WebSocket client. Activity Protocol samples use a different playground. See Choose another protocol or sample for the appropriate local testing path.
Use the Inspector
Start with one request that exercises the behavior you want to understand. For example, if you're investigating a weather tool, ask for information that requires that tool rather than a general answer the model can produce without it.
- Send the request in the playground and review the streaming response.
- Use the details tabs to find the slow or failing operation.
- Inspect the relevant event or tool call, change your code or configuration, and repeat the request.
In the input, press Enter to send or Shift+Enter to add a newline. To recall an earlier request, place the caret at the start of the input and press Up. Press Down at the end of the input to move toward newer requests and return to your unsent draft. You can edit a recalled request before sending it. This input history is a convenience within Inspector, not a durable store of saved prompts.
The Responses details tabs answer different questions:
| View | Use it to |
|---|---|
| Overview | Follow the latency waterfall and ordered run timeline. Select all runs or one run to distinguish model and tool activity from time spent waiting between runs. |
| Tokens | Review the input and output token usage reported for responses. Missing usage data isn't a zero-token result. |
| Events | Inspect the parsed Responses events, including errors, function calls, and results. Search by event type or JSON content and filter by category. |
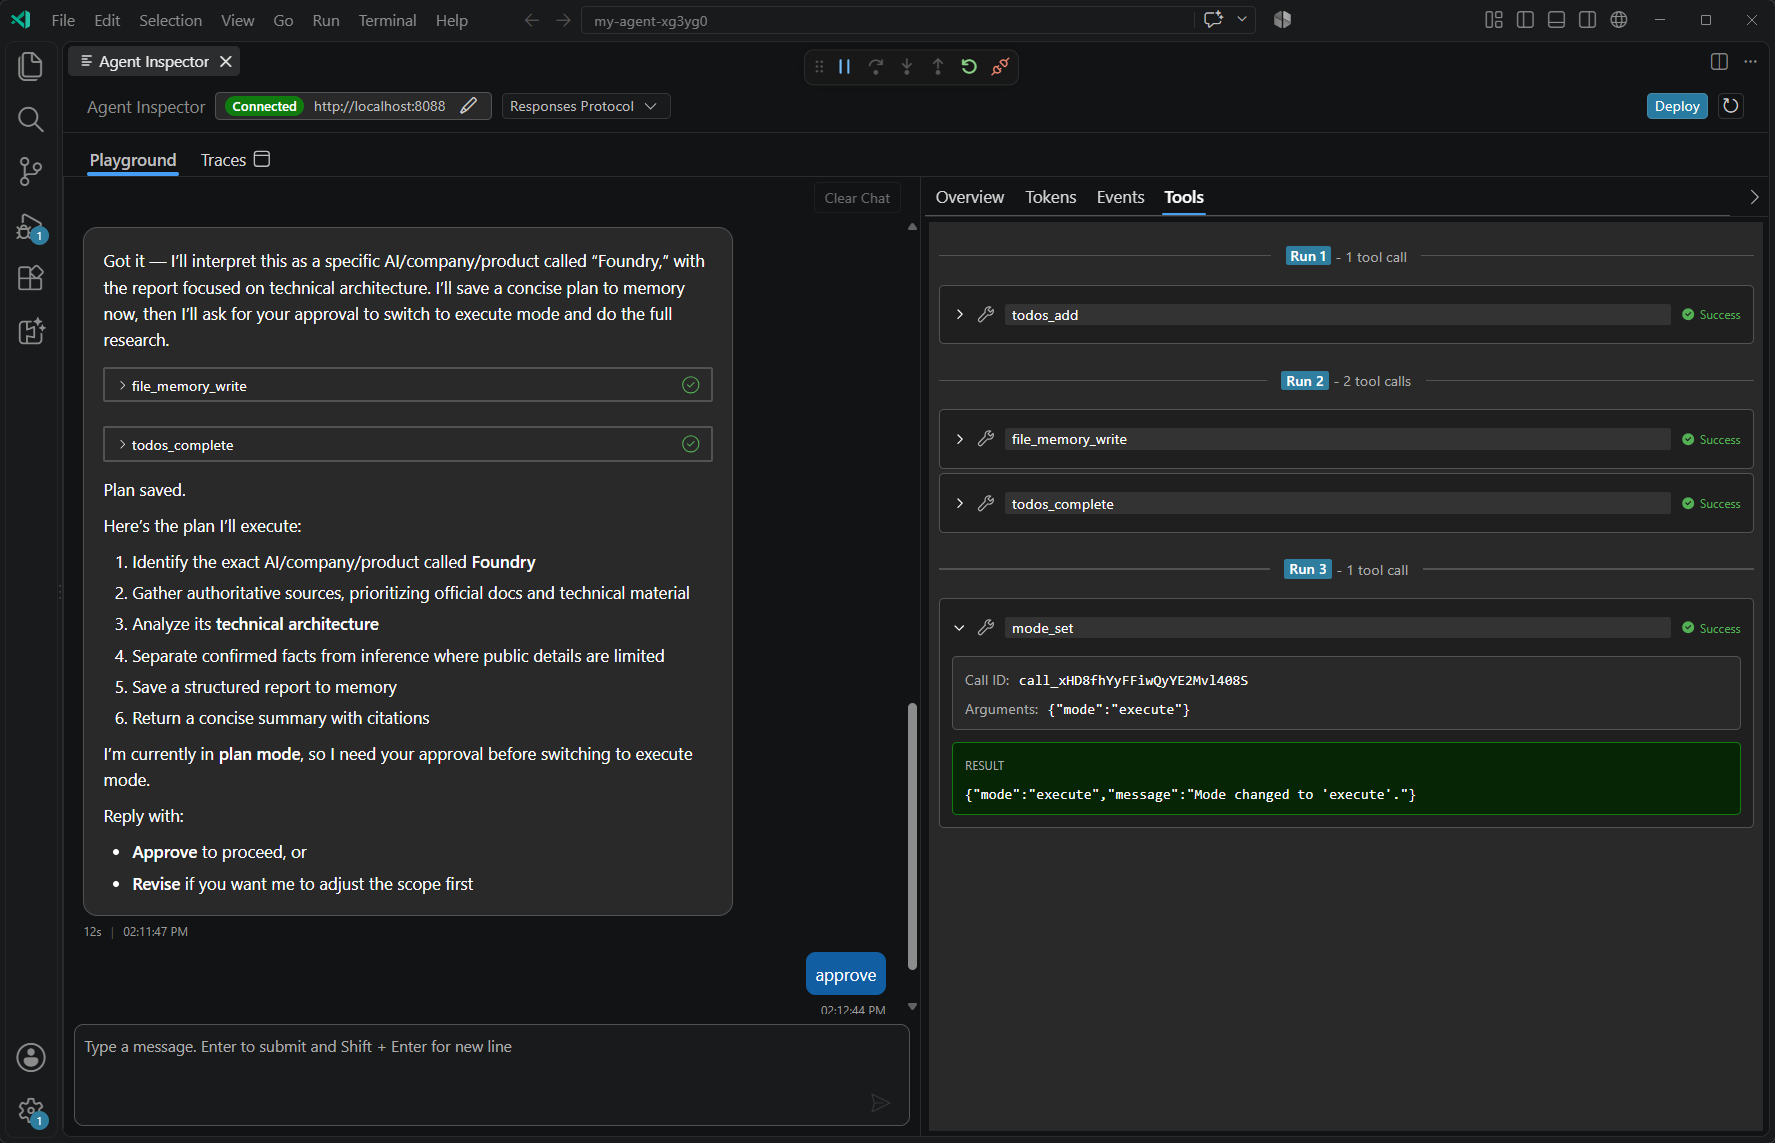
| Tools | Inspect tool calls grouped by response run, including status, call ID, arguments, and results. |
The response footer shows model, duration, token usage, and timestamp information when provided. Reasoning text and reasoning summaries appear in separate collapsible sections when the agent emits them. Inspector doesn't generate missing reasoning or expose information the model provider doesn't return.
Inspect tools and permissions
Use Tools to check whether the agent called the expected tool with the expected arguments and received a result. A successful model response doesn't prove that a tool ran. If your agent code uses a mock, the displayed result is still a mock result.
When a response pauses for MCP approval or OAuth consent, the pending requests appear above the message input. Grant only the access you intend to allow.
For an MCP tool call, select Show arguments to inspect its inputs, then select Approve or Deny. Approve all and Deny all apply the same decision to the pending requests, not a permanent tool approval policy.
For OAuth consent, complete both the browser authorization and the Inspector confirmation:
- Select Open consent for the pending request.
- Complete the authorization in the browser, return to Inspector, and select Consent done. If you don't want to authorize the request, select Cancel instead.
- Resolve the remaining consent requests. When All done is available, use it only after completing authorization for all the opened requests.
Opening a consent page alone doesn't resume the request. Inspector waits for a decision on each pending consent before checking the server again. Requests can reappear if the server still needs authorization. Check the subsequent tool result, not only the approval, to confirm the operation completed.
For tool connection and authentication setup, follow Tool Catalog. Don't change tool credentials or permissions solely to make a diagnostic error disappear.
Inspect workflows and source code
For supported Agent Framework workflows, the development server can provide workflow diagnostics and source locations so Inspector can show the execution graph and help you navigate to your code:
- Select a workflow node to inspect the available inputs and outputs.
- Double-click the node to open its source location.
- Set a breakpoint and repeat the request to inspect the operation in the debugger.
You can test LangGraph workflows in the playground, but workflow visualization isn't supported for them. A server without workflow metadata can still return useful response events.
Investigate failures with Copilot
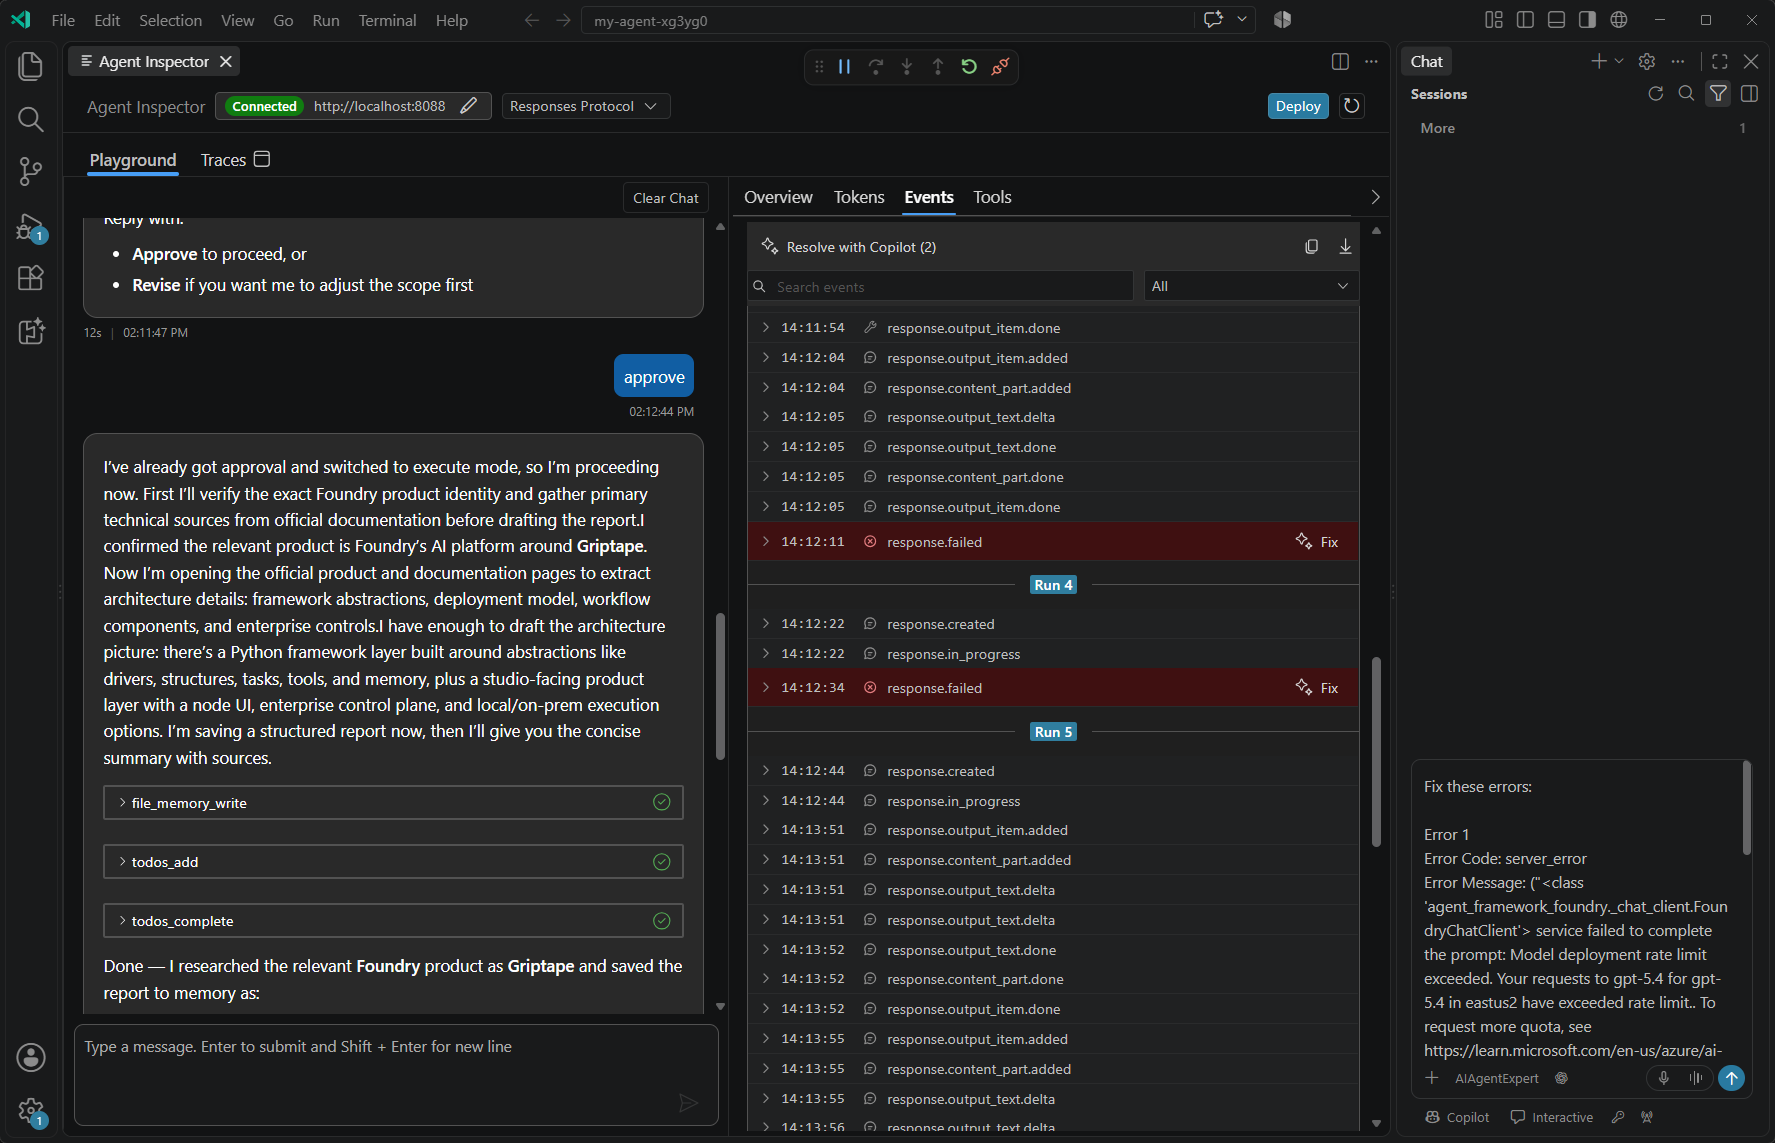
Use the error actions in Events to prepare a focused request for GitHub Copilot, rather than copying the entire conversation.
- Find the failed event and review its details for sensitive content before sharing them.
- Select Fix beside the failed event to prepare a prompt for that failure. To include several failures, narrow the Events list with search and category filters, then select Resolve with Copilot. This action includes the visible failures.
- Review the prepared prompt in GitHub Copilot Chat before sending it. Review any proposed code or configuration changes, then rerun the original agent request to confirm the result.
These actions don't require the OTLP collector. Preparing a diagnostic prompt doesn't fix the agent or rerun the failed operation.
Save diagnostic events
Use an event snapshot when you need to compare a failure with a later run or share a focused reproduction.
- In Events, narrow the list with the search field and category filter.
- Select Copy visible events to copy the filtered events as JSONL, or Download visible events to open the export in VS Code.
- For the opened export, use File > Save As to save a copy in a location you control before closing the document. The opened export is a temporary file, not a permanent download.
The snapshot contains the events visible when you select the action, not future events from the running agent. It doesn't save an agent version, deploy your code, or create cloud trace history.
Events can include prompts, responses, tool arguments, results, and error details. Review and redact sensitive content before saving or sharing an export.
Start a fresh conversation
Select Clear Chat to start a new conversation and clear the chat, Events, and Details state. Export any diagnostic events you need first. Refreshing the same connected agent preserves its inspection state, while changing agents clears stale state.
For Responses, Clear Chat is disabled while a response is actively streaming, but remains available when the turn is paused for approval or consent. It isn't a general command to stop your agent.
Don't rely on local Inspector state as a durable conversation archive. The server owns conversation persistence, which can differ between local development and a deployed hosted agent. Clearing Inspector doesn't delete traces already collected locally or stored in Application Insights.
How Inspector and tracing differ
Inspector communicates with your local server over HTTP and streams response events. A compatible development server also supplies a separate diagnostics stream for workflow details and source navigation. The debugger attaches to your running process independently of those streams.
These live diagnostics don't require the local OTLP collector. Inspector's Traces tab opens the separate tracing viewer. It doesn't turn protocol events into stored OpenTelemetry spans. To collect spans for later analysis, configure local tracing. For deployed agents, use hosted-agent traces.
After local testing, follow the existing hosted-agent deployment procedure. Test the deployed agent separately because its identity, environment, and network access differ from your local process.
Troubleshooting
| Issue | What to check |
|---|---|
| Inspector can't connect. | Check the agent terminal for startup errors. Confirm the interpreter, installed dependencies, and HTTP port, then reconnect to the port the server reports. Opening Inspector doesn't start the process. |
| A request succeeds but breakpoints aren't hit. | Confirm the debugger is attached to the process serving the request and that the debug configuration uses the correct source directory. For Python, see debugging troubleshooting. |
| The graph or source navigation is missing. | Confirm the server and workflow provide development diagnostics and source locations. Generic Responses inspection doesn't provide these capabilities. LangGraph workflows work in the playground without workflow visualization. |
| Tool results are missing. | Check Events for failures and pending approvals. Confirm the request actually requires a tool and that the tool is configured and reachable. |
| Token or reasoning details are missing. | Check what the model and server emit. Inspector can only display the information they provide. |
| Remote images in a response are blocked. | Select Load Remote Images only if you want Inspector to fetch them from the remote hosts. Loading is a display permission, not a tool approval. Unsupported image URLs or content can still fail to load, and a missing image doesn't necessarily mean the agent request failed. |
| The response stream is interrupted. | Review the partial response and failure details. Reconnect if needed and review pending approvals before retrying. A retry can repeat live tool actions. |
| Inspector has events but the tracing viewer is empty. | Protocol events and OTLP spans are different. Configure instrumentation and start the collector using the tracing guide. |